

Question: QUESTION 6 Estimate the population regression model: In(TestScore) =B+B In(STR) +Income, + B Lunch, +u, i where In(x) denotes the natural log of x.
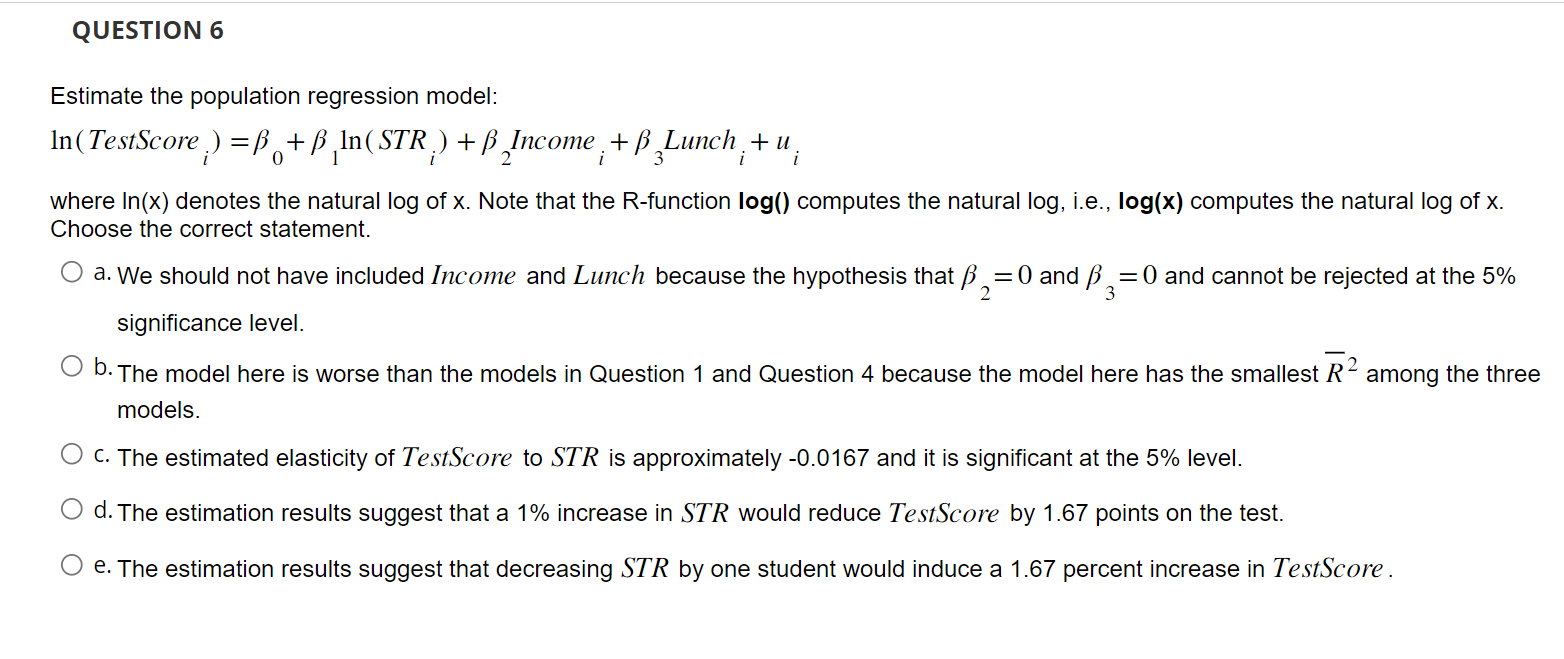
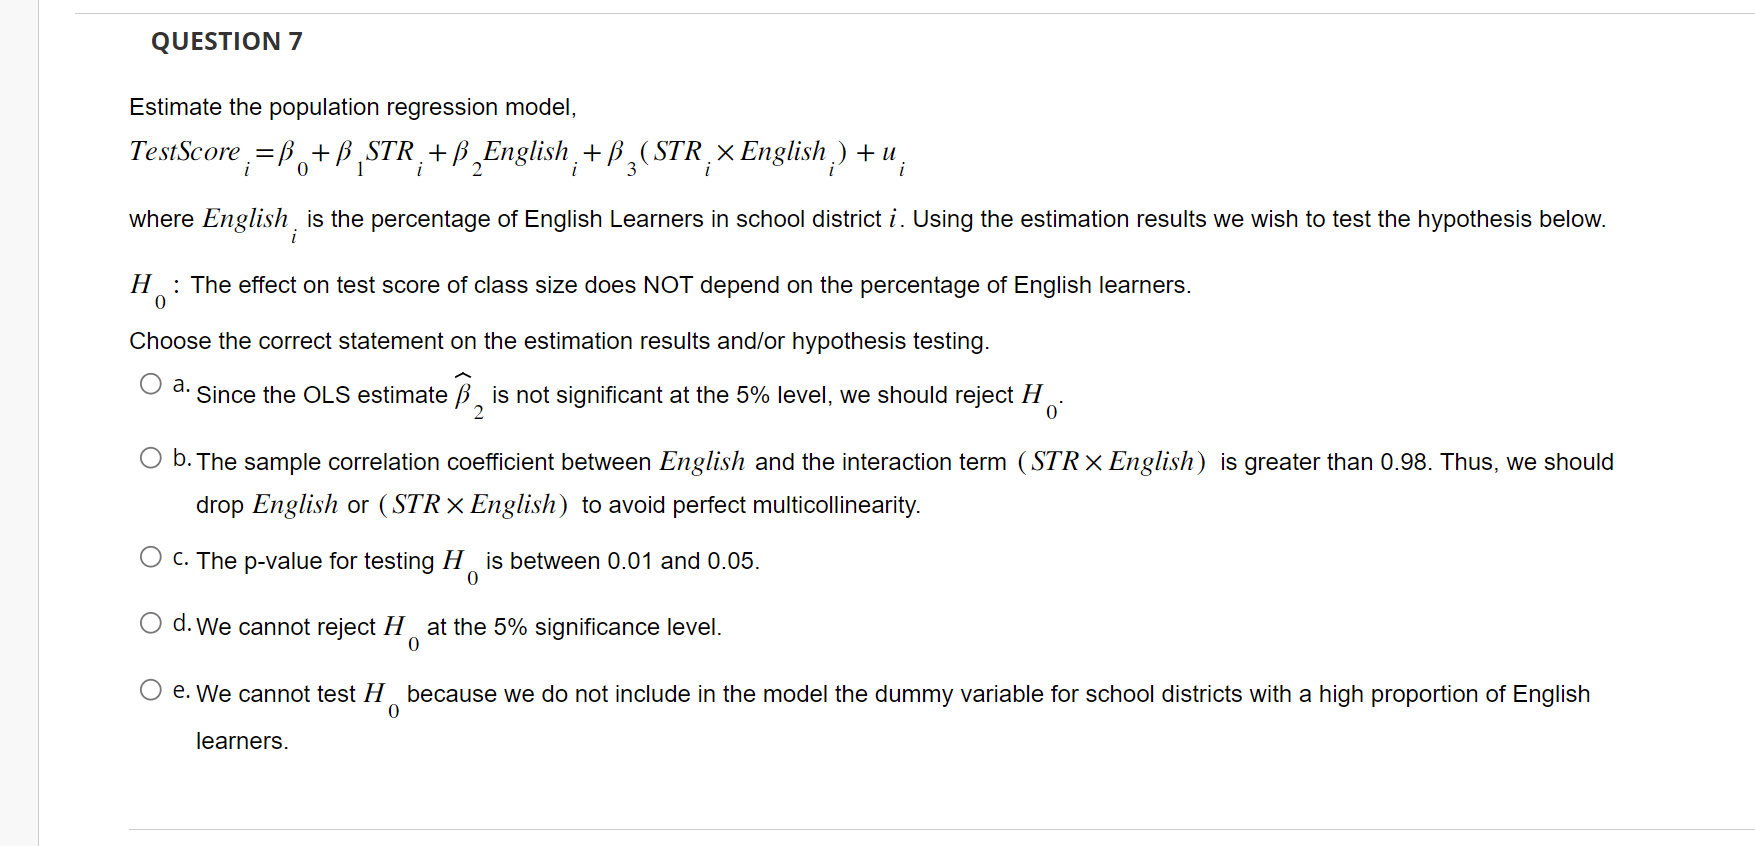
QUESTION 6 Estimate the population regression model: In(TestScore) =B+B In(STR) +Income, + B Lunch, +u, i where In(x) denotes the natural log of x. Note that the R-function log() computes the natural log, i.e., log(x) computes the natural log of x. Choose the correct statement. a. We should not have included Income and Lunch because the hypothesis that =0 and 3=0 and cannot be rejected at the 5% significance level. 2 b. The model here is worse than the models in Question 1 and Question 4 because the model here has the smallest R among the three models. Oc. The estimated elasticity of TestScore to STR is approximately -0.0167 and it is significant at the 5% level. Od. The estimation results suggest that a 1% increase in STR would reduce TestScore by 1.67 points on the test. e. The estimation results suggest that decreasing STR by one student would induce a 1.67 percent increase in TestScore. QUESTION 7 Estimate the population regression model, TestScore 0 i 2 = + STR + English + 3 (STR English) + u i i where English is the percentage of English Learners in school district i. Using the estimation results we wish to test the hypothesis below. i H: The effect on test score of class size does NOT depend on the percentage of English learners. 0 Choose the correct statement on the estimation results and/or hypothesis testing. a. Since the OLS estimate , is not significant at the 5% level, we should reject H 0 2 O b. The sample correlation coefficient between English and the interaction term (STR English) is greater than 0.98. Thus, we should drop English or (STR English) to avoid perfect multicollinearity. c. The p-value for testing H is between 0.01 and 0.05. 0 d. We cannot reject H at the 5% significance level. 0 e. We cannot test H because we do not include in the model the dummy variable for school districts with a high proportion of English learners. 0 FURTHER INFORMATION ABOUT R-EXERCISE 3: Data and Packages: We use the dataset "MASchools" in the package "AER" like we did in R-Exercise 2. The dataset contains information on test performance, school characteristics and student demographic backgrounds for school districts in Massachusetts (MA). In this exercise, we shall use R-functions in the packages "estimate" and "AER" (or "car"). We wish to learn the effect of student-teacher ratio (STR) on the 4th grade score (TestScore), which is defined as the sum of math, English, and science. In order to control for omitted variable bias, we shall include a few other additional variables and consider various functional forms. For all estimation exercises here the type of standard error should be "HC1" or equivalently "stata".
Step by Step Solution
There are 3 Steps involved in it

Get step-by-step solutions from verified subject matter experts