

Question: The data listed below represent the number of people who visit the zoo on an yearly pass, along with the number of visits per
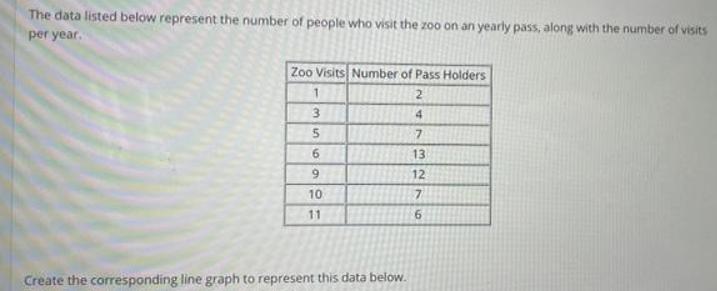
The data listed below represent the number of people who visit the zoo on an yearly pass, along with the number of visits per year. Zoo Visits Number of Pass Holders 2 3 6. 13 12 10 11 Create the corresponding line graph to represent this data below. 99 The data listed below represent the number of people who visit the zoo on an yearly pass, along with the number of visits per year. Zoo Visits Number of Pass Holders 2 3 6. 13 12 10 11 Create the corresponding line graph to represent this data below. 99 The data listed below represent the number of people who visit the zoo on an yearly pass, along with the number of visits per year. Zoo Visits Number of Pass Holders 2 3 6. 13 12 10 11 Create the corresponding line graph to represent this data below. 99 The data listed below represent the number of people who visit the zoo on an yearly pass, along with the number of visits per year. Zoo Visits Number of Pass Holders 2 3 6. 13 12 10 11 Create the corresponding line graph to represent this data below. 99 The data listed below represent the number of people who visit the zoo on an yearly pass, along with the number of visits per year. Zoo Visits Number of Pass Holders 2 3 6. 13 12 10 11 Create the corresponding line graph to represent this data below. 99
Step by Step Solution
3.48 Rating (155 Votes )
There are 3 Steps involved in it
Here is your solution hope it helps One th... View full answer

Get step-by-step solutions from verified subject matter experts