

Question: Question 6: Linear Regression Showing Relationship Please show all steps/work/formulas Dr. Lillian Fok, a New Orleans psychologist, specializes in treating patients who are agoraphobic (i.e.,
Question 6: Linear Regression Showing Relationship
Please show all steps/work/formulas
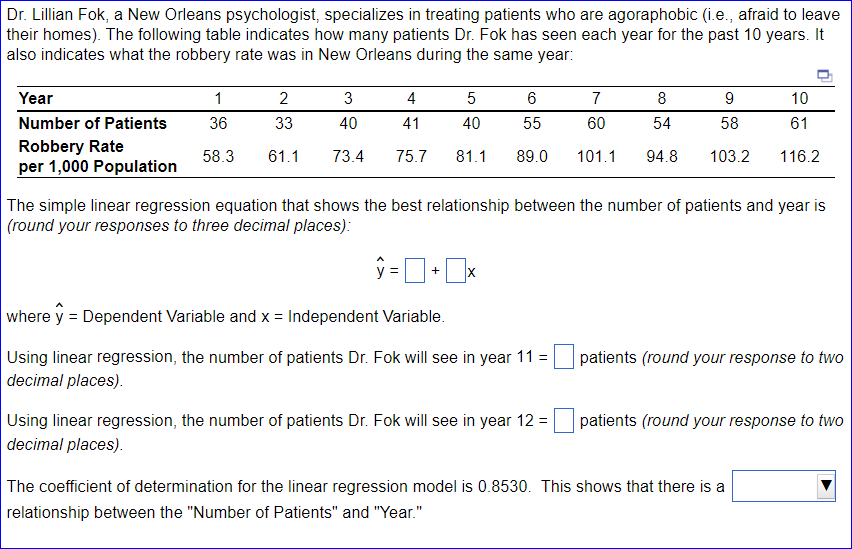
Dr. Lillian Fok, a New Orleans psychologist, specializes in treating patients who are agoraphobic (i.e., afraid to leave their homes). The following table indicates how many patients Dr. Fok has seen each year for the past 10 years. It also indicates what the robbery rate was in New Orleans during the same year: - Year 1 2 3 4 9 G 7 8 9 10 Number of Patients 36 33 40 41 40 25 60 24 58 61 Robbery Rate per 1,000 Population 583 61.1 734 757 811 890 1011 948 103.2 116.2 The simple linear regression equation that shows the best relationship between the number of patients and year is (round your responses to three decimal places): V= D + |:|X where ; = Dependent Variable and x = Independent Variable. Using linear regression, the number of patients Dr. Fok will see in year 11 = D patients (round your response fo fwo decimal places). Using linear regressicn, the number of patients Dr. Fok will see in year 12 = D patients {round your response o fwo decimal places). The coefficient of determination for the linear regression model is 0.8530. This shows that there is a |:| relationship between the "Number of Patients" and "Year."
Step by Step Solution
There are 3 Steps involved in it

Get step-by-step solutions from verified subject matter experts