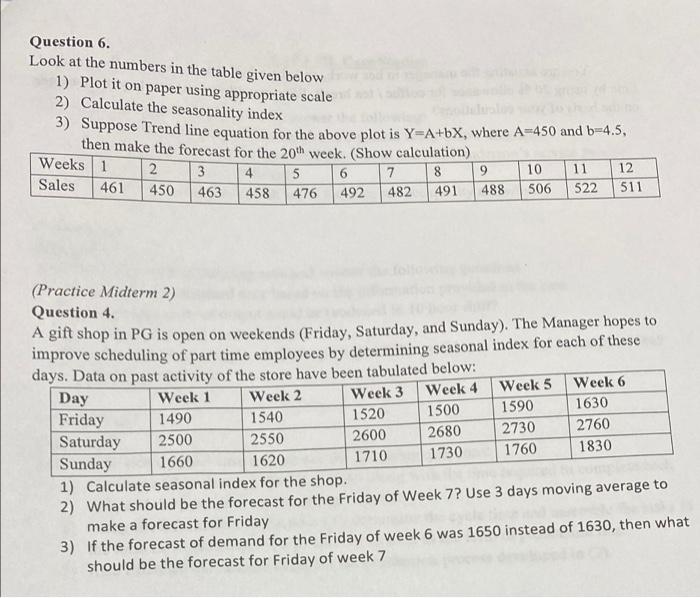
Question: Question 6. Look at the numbers in the table given below 1) Plot it on paper using appropriate scale 2) Calculate the seasonality index 3)

Question 6. Look at the numbers in the table
Question 6. Look at the numbers in the table given below 1) Plot it on paper using appropriate scale 2) Calculate the seasonality index 3) Suppose Trend line equation for the above plot is Y=A+bX, where A-450 and b-4.5, then make the forecast for the 20th week. (Show calculation) Weeks 1 2 3 4 5 6 7 12 9 10 11 Sales 461 450 463 458 476 492 482 511 491 488 506 8 522 Friday (Practice Midterm 2) Question 4. A gift shop in PG is open on weekends (Friday, Saturday, and Sunday). The Manager hopes to improve scheduling of part time employees by determining seasonal index for each of these days. Data on past activity of the store have been tabulated below: Day Week 1 Week 2 Week 3 Week 4 Week 5 Week 6 1490 1540 1520 1500 1590 1630 Saturday 2500 2550 2600 2680 2730 2760 Sunday 1660 1620 1710 1730 1760 1830 1) Calculate seasonal index for the shop. 2) What should be the forecast for the Friday of Week 7? Use 3 days moving average to make a forecast for Friday 3) If the forecast of demand for the Friday of week 6 was 1650 instead of 1630, then what should be the forecast for Friday of week 7

Step by Step Solution

There are 3 Steps involved in it

1 Expert Approved Answer
Step: 1 Unlock blur-text-image
Question Has Been Solved by an Expert!

Get step-by-step solutions from verified subject matter experts

Step: 2 Unlock
Step: 3 Unlock

Students Have Also Explored These Related General Management Questions!