

Question: Question 6 - Part 2Calculate the test statistic.= Question 5 -Calculate the test statistic.= Question 3 -Calculate the p-value. any help please I got everything
Question 6 - Part 2Calculate the test statistic.=
Question 5 -Calculate the test statistic.=
Question 3 -Calculate the p-value. any help please I got everything correct expect these 3 questions
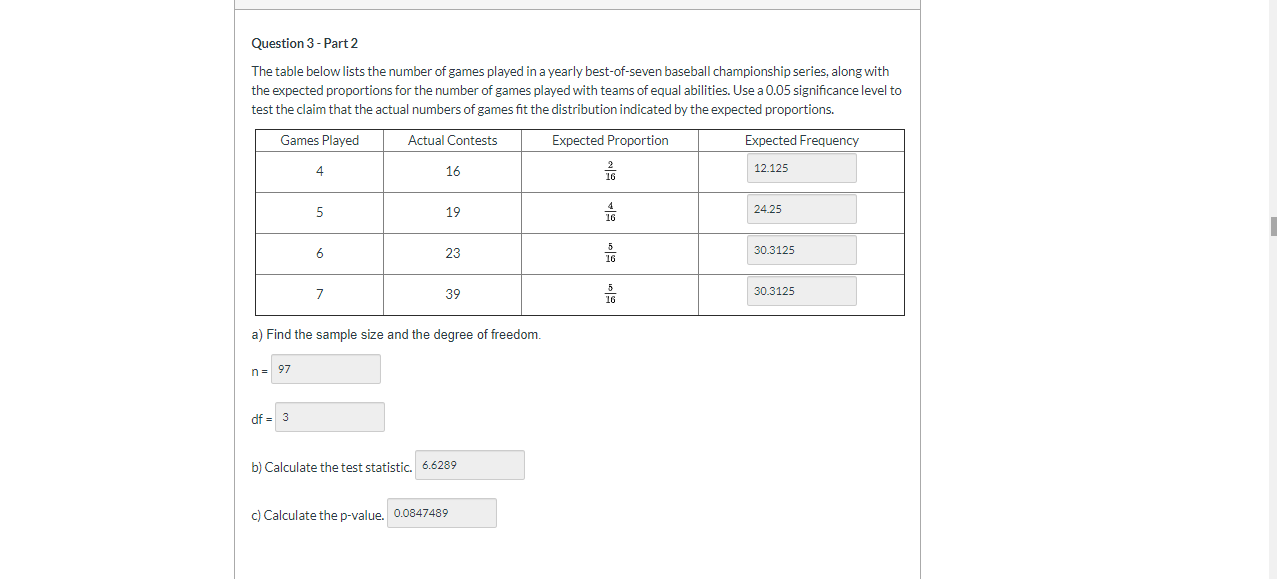
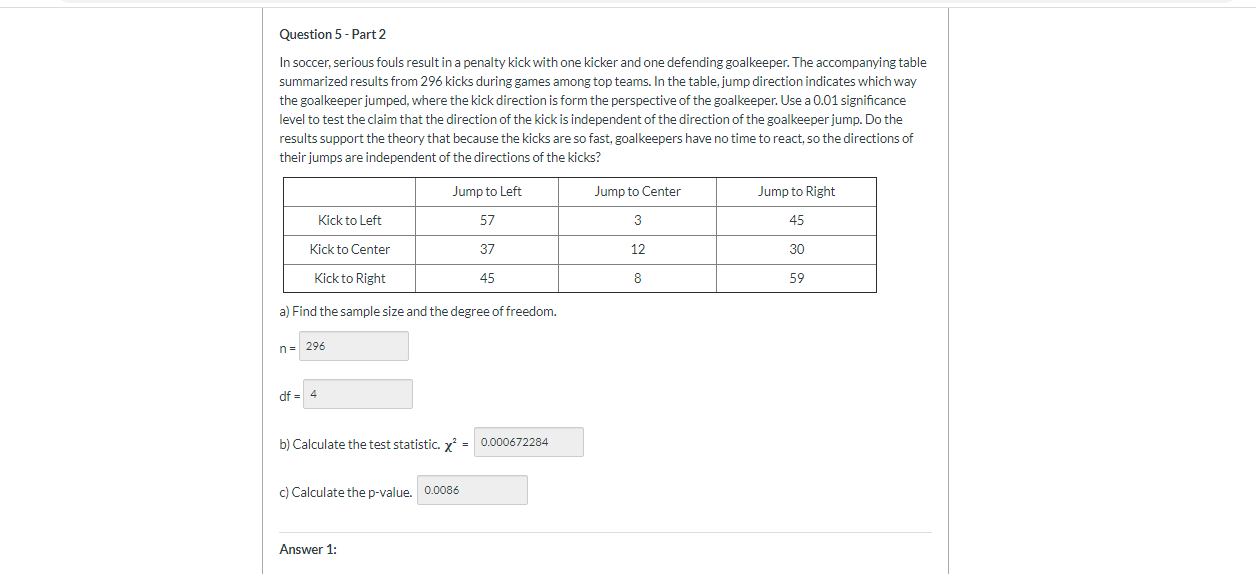
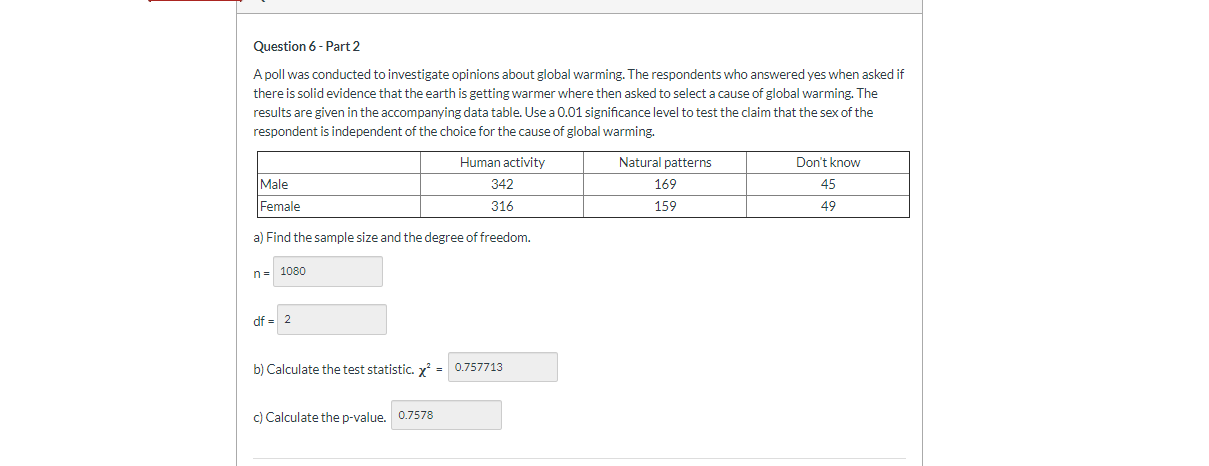
Question 3 - Part 2 The table below lists the number of games played in a yearly best-of-seven baseball championship series, along with the expected proportions for the number of games played with teams of equal abilities. Use a 0.05 significance level to test the claim that the actual numbers of games fit the distribution indicated by the expected proportions. Games Played Actual Contests Expected Proportion Expected Frequency 4 16 16 12.125 5 19 16 24.25 6 23 16 30.3125 7 39 16 30.3125 a) Find the sample size and the degree of freedom. n = 97 df = 3 b) Calculate the test statistic. 6.6289 c) Calculate the p-value. 0.0847489Question 5 - Part 2 In soccer, serious fouls result in a penalty kick with one kicker and one defending goalkeeper. The accompanying table summarized results from 296 kicks during games among top teams. In the table, jump direction indicates which way the goalkeeper jumped, where the kick direction is form the perspective of the goalkeeper. Use a 0.01 significance level to test the claim that the direction of the kick is independent of the direction of the goalkeeper jump. Do the results support the theory that because the kicks are so fast, goalkeepers have no time to react, so the directions of their jumps are independent of the directions of the kicks? Jump to Left Jump to Center Jump to Right Kick to Left 57 3 45 Kick to Center 37 17 30 Kick to Right 45 8 59 a) Find the sample size and the degree of freedom. n = 296 df = 4 b) Calculate the test statistic. x* = 0.000672284 c) Calculate the p-value. 0.0086 Answer 1:Question 6 - Part 2 A poll was conducted to investigate opinions about global warming. The respondents who answered yes when asked if there is solid evidence that the earth is getting warmer where then asked to select a cause of global warming. The results are given in the accompanying data table. Use a 0.01 significance level to test the claim that the sex of the respondent is independent of the choice for the cause of global warming. Human activity Natural patterns Don't know Male 342 169 45 Female 316 159 49 a) Find the sample size and the degree of freedom. n= 1080 df = 2 b) Calculate the test statistic. x* = 0.757713 c) Calculate the p-value. 0.7578
Step by Step Solution
There are 3 Steps involved in it

Get step-by-step solutions from verified subject matter experts