

Question: QUESTION 6 (Points 30) 6. Comparative balance sheets report average total assets for the year of $2,575,000 and average total equity of $1,917,000 (dollar amounts
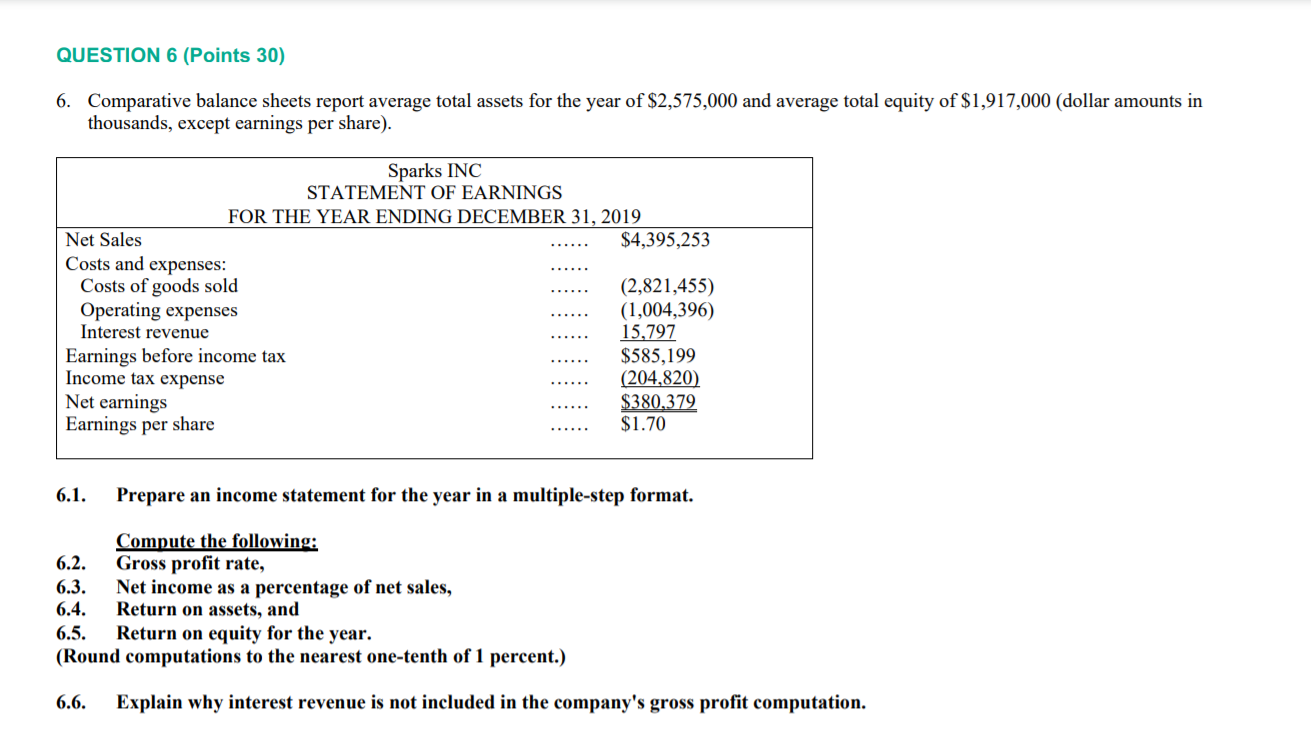
QUESTION 6 (Points 30) 6. Comparative balance sheets report average total assets for the year of $2,575,000 and average total equity of $1,917,000 (dollar amounts in thousands, except earnings per share). Sparks INC STATEMENT OF EARNINGS FOR THE YEAR ENDING DECEMBER 31, 2019 Net Sales $4,395,253 Costs and expenses: Costs of goods sold (2,821,455) Operating expenses (1,004,396) Interest revenue 15,797 Earnings before income tax $585,199 Income tax expense (204,820) Net earnings $380,379 Earnings per share $1.70 6.1. Prepare an income statement for the year in a multiple-step format. Compute the following: 6.2. Gross profit rate, 6.3. Net income as a percentage of net sales, 6.4. Return on assets, and 6.5. Return on equity for the year. (Round computations to the nearest one-tenth of 1 percent.) 6.6. Explain why interest revenue is not included in the company's gross profit computation
Step by Step Solution
There are 3 Steps involved in it

Get step-by-step solutions from verified subject matter experts