

Question: QUESTION 6 Sample B - Large data sample Birth year Height Belly Sample B - Large data sample button In this section, you will process
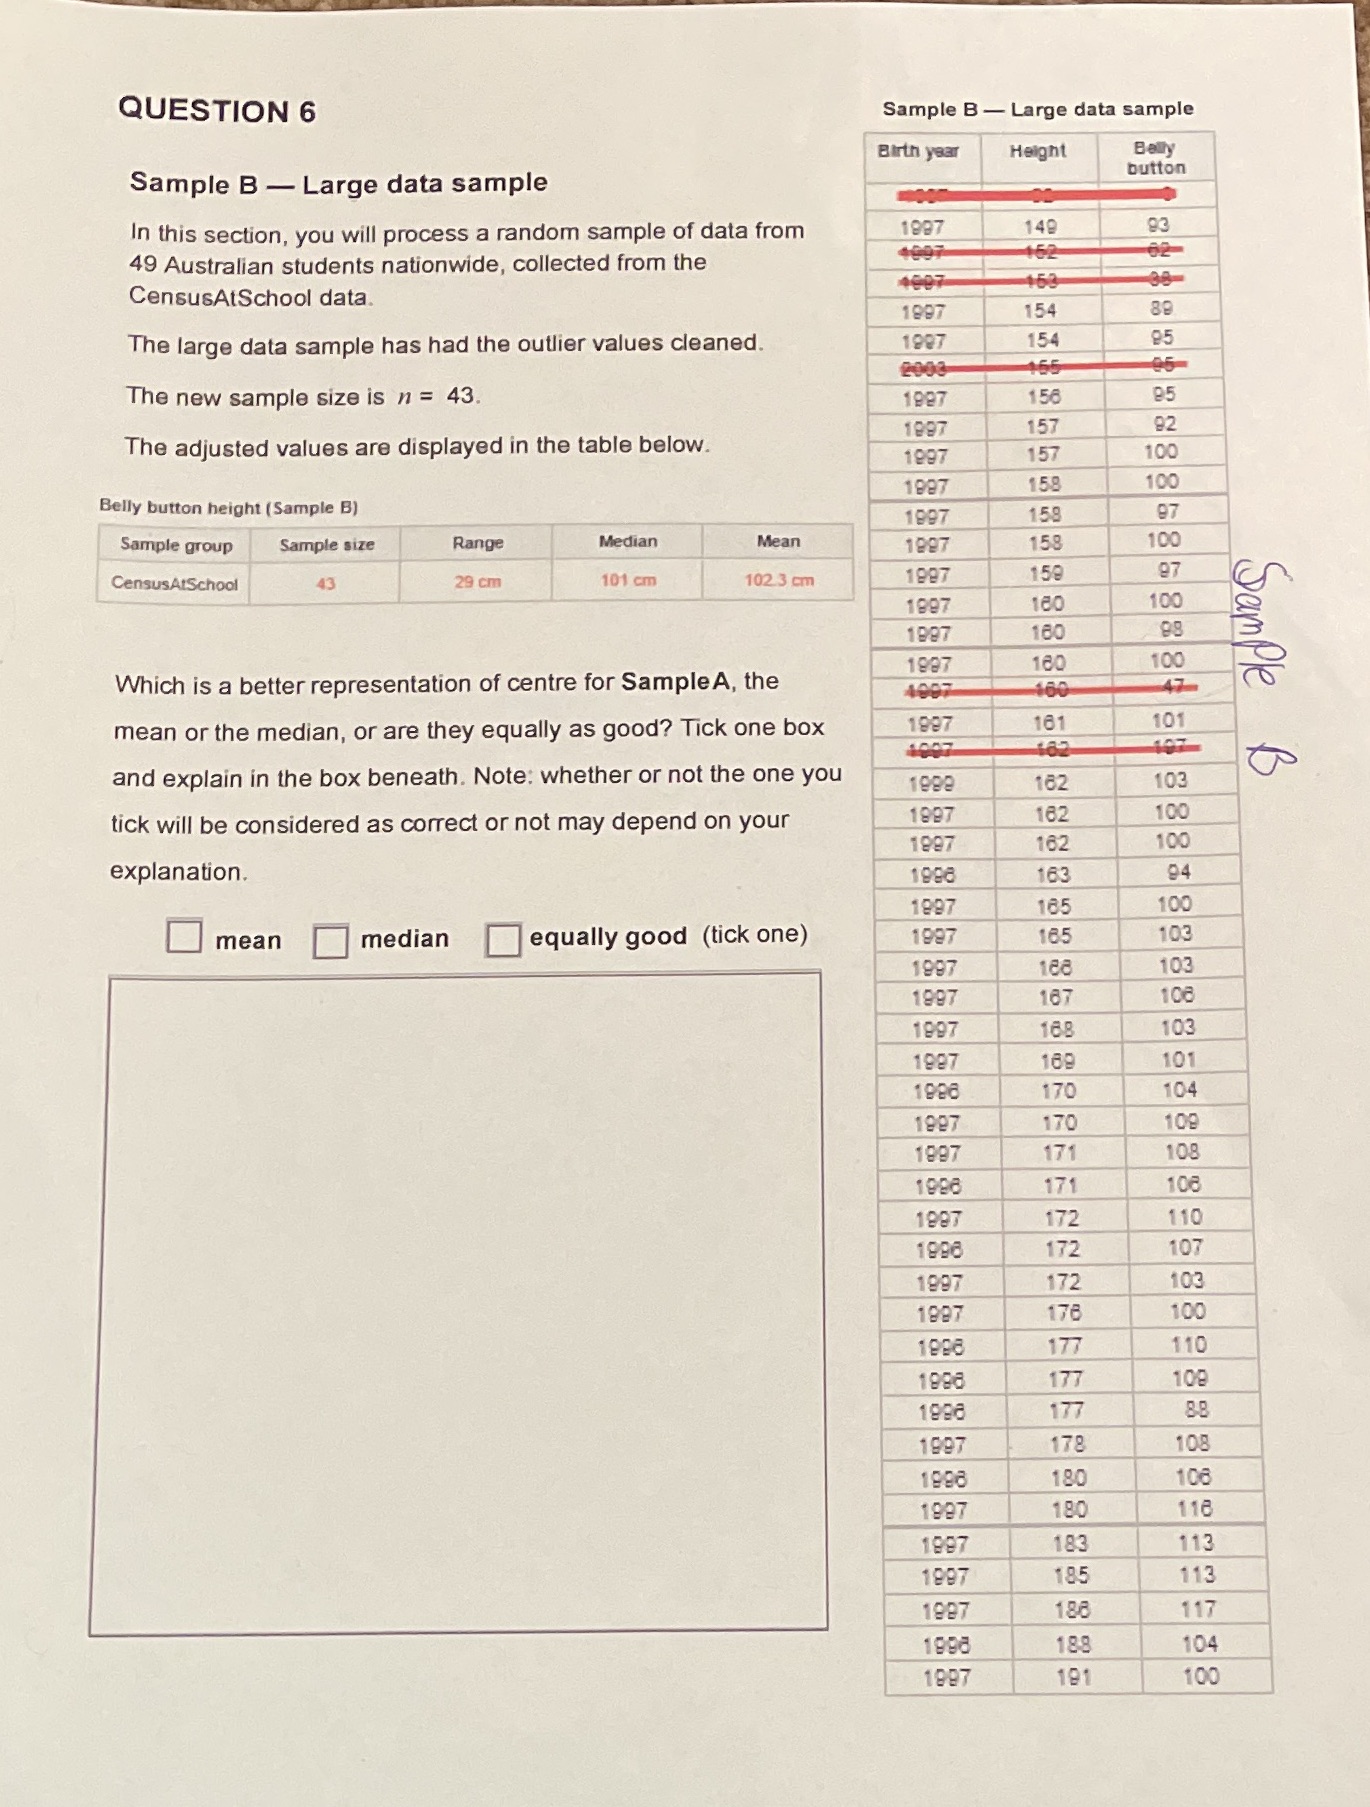
QUESTION 6 Sample B - Large data sample Birth year Height Belly Sample B - Large data sample button In this section, you will process a random sample of data from 149 93 49 Australian students nationwide, collected from the 4697 CensusAtSchool data. 1681 154 89 The large data sample has had the outlier values cleaned. 1907 154 95 2903 The new sample size is n = 43. 1907 156 95 157 92 The adjusted values are displayed in the table below. 1097 157 100 158 100 Belly button height (Sample B) 1897 158 97 Sample group Sample size Range Median Mean 1897 158 100 CensusAtSchool 29 cm 101 cm 102 3 cm 1987 150 97 180 100 98 Sample 1987 160 180 100 Which is a better representation of centre for Sample A, the 4007 460 47 mean or the median, or are they equally as good? Tick one box 161 101 1907 407 and explain in the box beneath. Note: whether or not the one you 182 103 tick will be considered as correct or not may depend on your 182 100 2681 162 100 explanation. 163 94 1897 185 100 mean median equally good (tick one) 1997 185 103 681 168 103 1997 187 108 1897 168 103 1987 189 101 1926 170 104 1897 170 109 1097 171 108 1908 171 108 1907 172 110 1926 172 107 1997 172 103 1987 176 100 1928 177 110 177 109 177 8.8 1907 178 108 180 106 1987 180 118 1681 183 113 185 113 1987 188 117 1998 188 104 1987 191 100
Step by Step Solution
There are 3 Steps involved in it

Get step-by-step solutions from verified subject matter experts