

Question: Question 6: Solve The Ratios, Could you show your work for the missing answers so that I understand the concepts? I'm just a student trying
Question 6: Solve The Ratios, Could you show your work for the missing answers so that I understand the concepts? I'm just a student trying to learn from a self-taught class. I'm confused about some of the missing information-- such as calculated average total assets; cash + short term investments + current receivables; net income - preferred dividends; and average total assets. 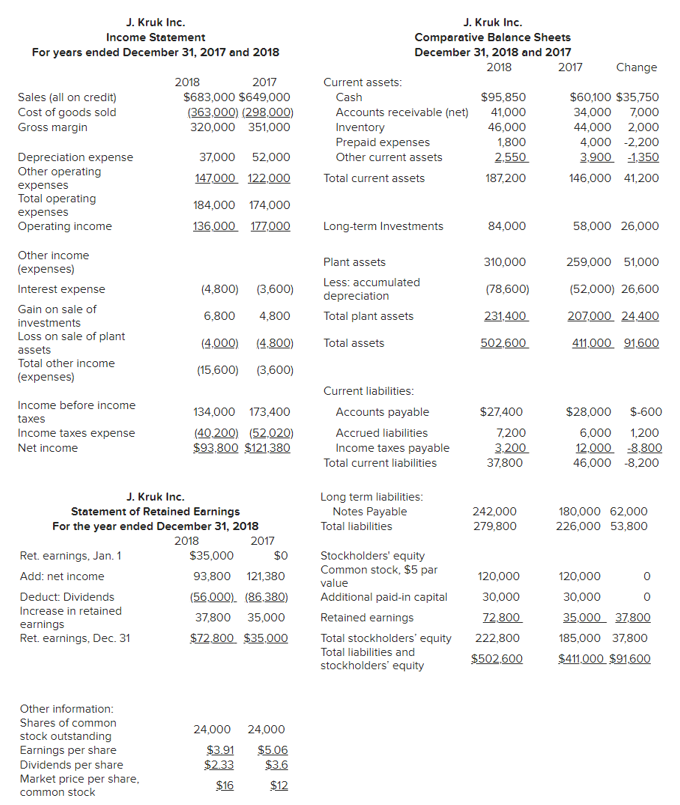
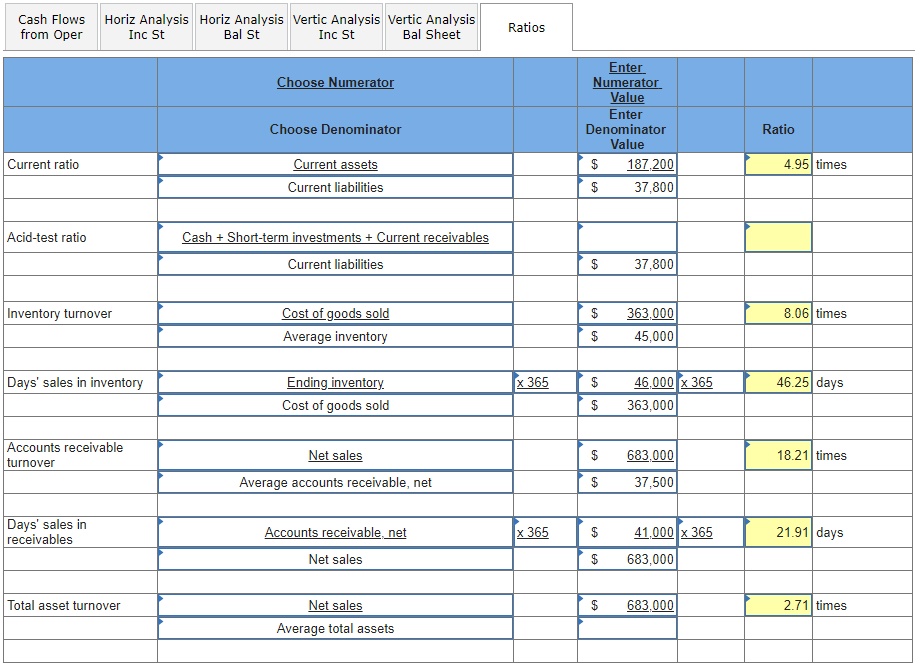
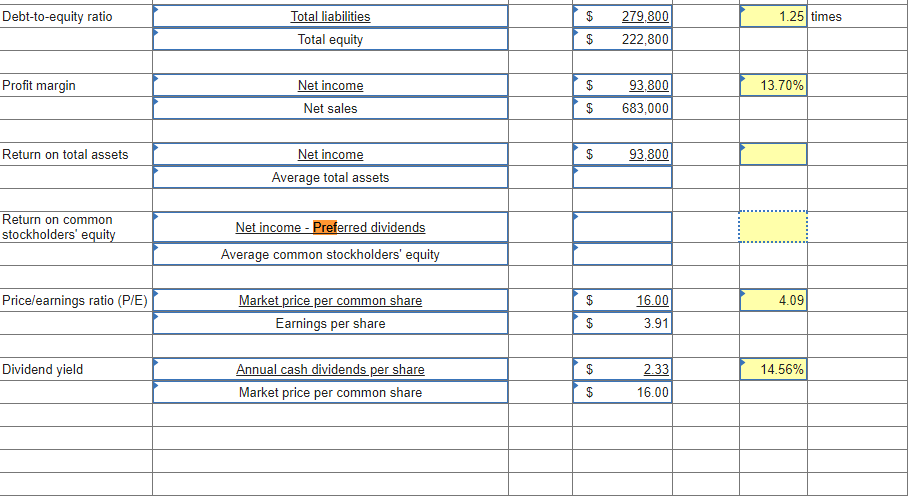
J. Kruk Inc. Income Statement For years ended December 31, 2017 and 2018 Sales (all on credit) Cost of goods sold Gross margin J. Kruk Inc. Comparative Balance Sheets December 31, 2018 and 2017 2018 2017 Change Current assets: Cash $95,850 $60,100 $35,750 Accounts receivable (net) 41,000 34,000 7,000 Inventory 46,000 44,000 2,000 Prepaid expenses 1,800 4,000 -2,200 Other current assets 2.550 3.900 1,350 Total current assets 187,200 146,000 41,200 2018 2017 $683,000 $649,000 (363.000) (298,000) 320,000 351,000 37,000 52,000 147.000 122.000 184,000 174,000 136.000 177.000 Depreciation expense Other operating expenses Total operating expenses Operating income Long-term Investments 84,000 58,000 26,000 (4,800) 3,600) 6,800 4,800 Plant assets Less: accumulated depreciation Total plant assets Total assets 310,000 (78,600) 231.400 502.600 259,000 51,000 (52,000) 26,600 207.000 24.400 411.000 91.600 (4.000) (4.800) Other income (expenses) Interest expense Gain on sale of investments Loss on sale of plant assets Total other income (expenses) Income before income taxes Income taxes expense Net income (15,600) (3,600) 134,000 173.400 (40.200) (52.020) $93.800 $121.380 Current liabilities: Accounts payable Accrued liabilities Income taxes payable Total current liabilities $27,400 7,200 3.200 37,800 $28,000 $-600 6,000 1,200 12.000 8.800 46,000 8,200 Long term liabilities: Notes Payable Total liabilities 242,000 279,800 180,000 62.000 226,000 53,800 J. Kruk Inc. Statement of Retained Earnings For the year ended December 31, 2018 2018 2017 Ret. earnings, Jan. 1 $35,000 $0 Add: net income 93,800 121,380 Deduct: Dividends (56.000). (86.380) Increase in retained 37,800 35,000 earnings Ret, earnings, Dec. 31 $72.800 $35.000 Stockholders' equity Common stock, $5 par value Additional paid-in capital Retained earnings Total stockholders' equity Total liabilities and stockholders' equity 120,000 30,000 72.800 222,800 $502.600 120,000 30.000 35000 37.800 185,000 37,800 $411000 $91.600 24,000 Other information: Shares of common stock outstanding Earnings per share Dividends per share Market price per share. common stock 24,000 $3.91 $2.33 $16 $506 $36 $12 Cash Flows Horiz Analysis Horiz Analysis Vertic Analysis Vertic Analysis from Oper Inc St Bal St Inc St Bal Sheet Ratios Choose Numerator Choose Denominator Enter Numerator Value Enter Denominator Value 187,200 $ 37,800 Ratio Current ratio 4.95 times Current assets Current liabilities Acid-test ratio Cash + Short-term investments + Current receivables Current liabilities $ 37,800 Inventory turnover $ 8.06 times Cost of goods sold Average inventory 363.000 45,000 $ Days' sales in inventory X 365 $ 46.25 days Ending inventory Cost of goods sold 46.000 x 365 363,000 $ Accounts receivable turnover $ 18.21 times Net sales Average accounts receivable, net 683.000 37,500 $ Days' sales in receivables x 365 $ 21.91 days Accounts receivable net Net sales 41.000 x 365 683,000 $ Total asset turnover $ 683.000 2.71 times Net sales Average total assets Debt-to-equity ratio 1.25 times Total liabilities Total equity 279,800 222,800 $ Profit margin $ 13.70% Net income Net sales 93.800 683,000 $ Return on total assets $ 93.800 Net income Average total assets Return on common stockholders' equity Net income - Preferred dividends Average common stockholders' equity Price/earnings ratio (P/E) $ 4.09 Market price per common share Earnings per share 16.00 3.91 $ Dividend yield 2.33 14.56% Annual cash dividends per share Market price per common share $ 16.00
Step by Step Solution
There are 3 Steps involved in it

Get step-by-step solutions from verified subject matter experts