

Question: Question 6 The following table shows the quantify sold and corresponding prices of all goods in a simple economy. The nominal GDP in 2019 was
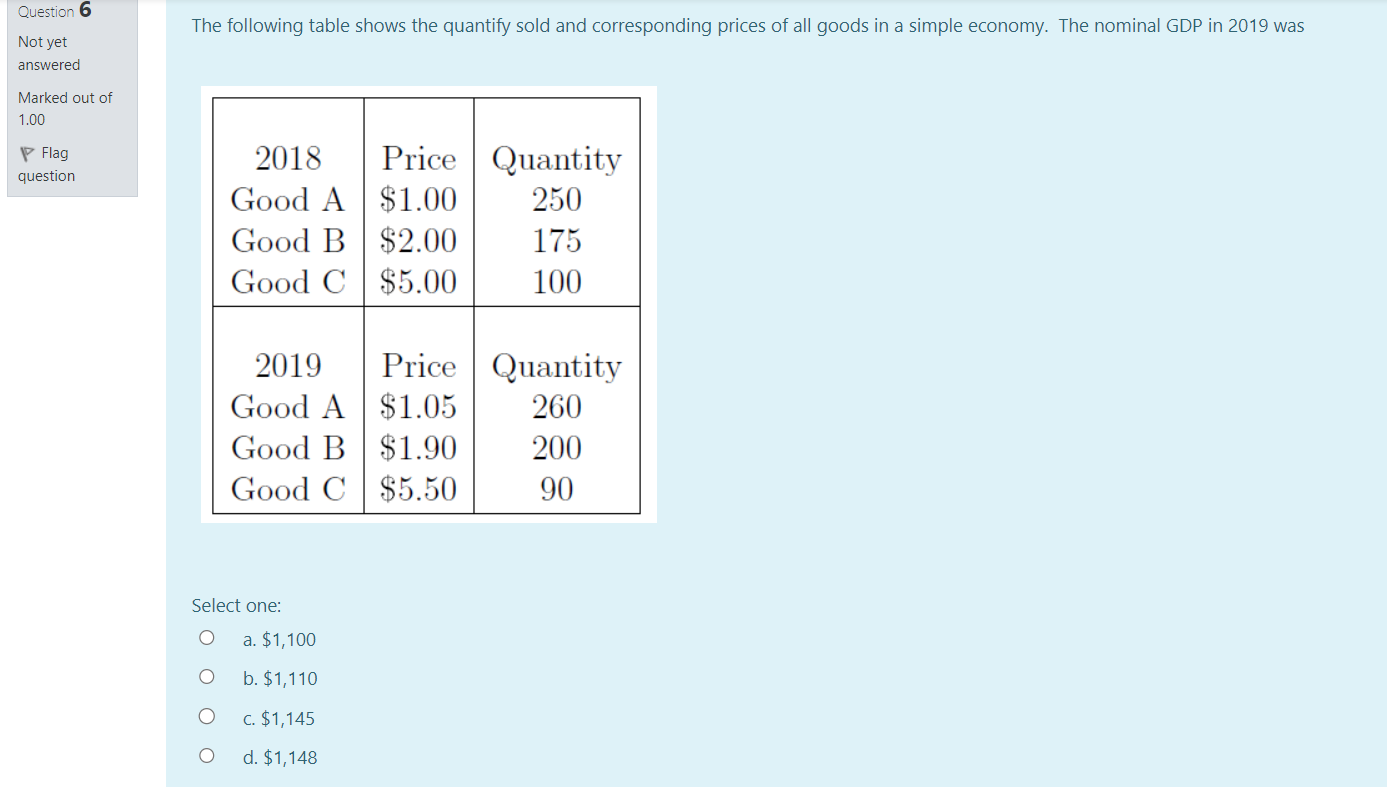
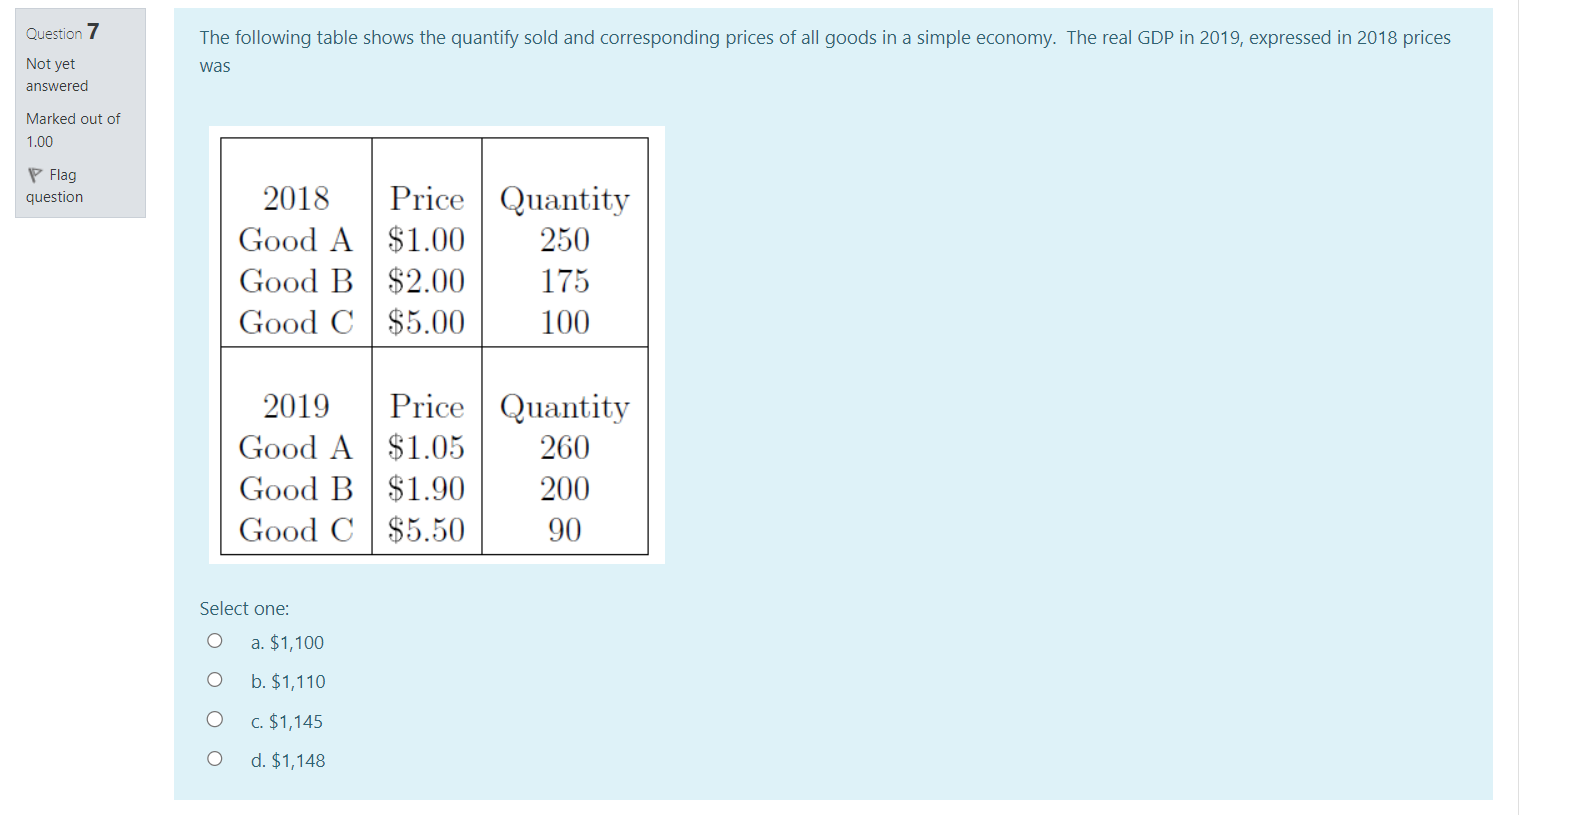
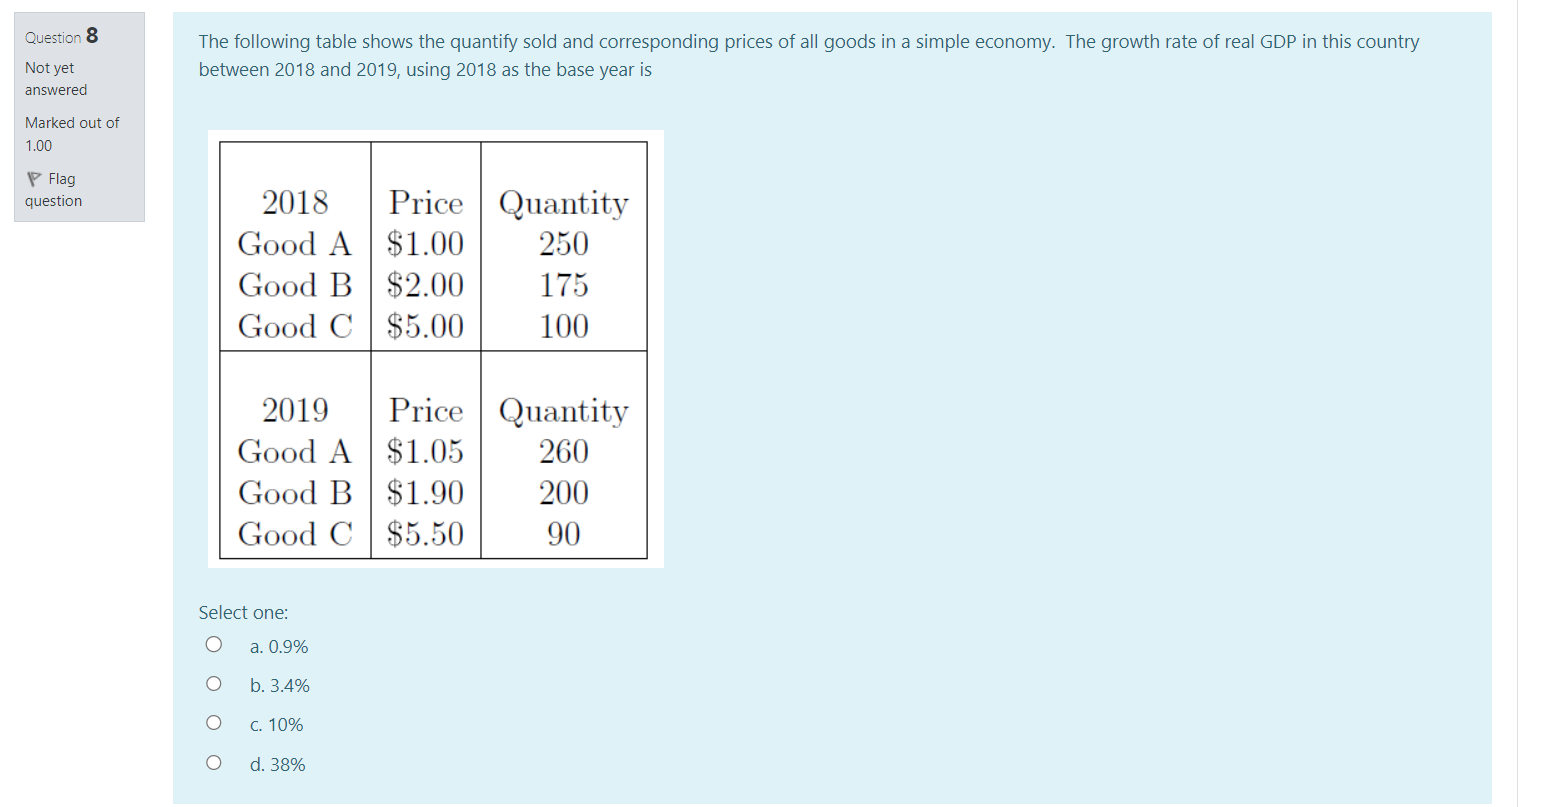
Question 6 The following table shows the quantify sold and corresponding prices of all goods in a simple economy. The nominal GDP in 2019 was Not yet answered Marked out of 1.00 Flag 2018 Price Quantity question Good A $1.00 250 Good B $2.00 175 Good C $5.00 100 2019 Price Quantity Good A $1.05 260 Good B $1.90 200 Good C $5.50 90 Select one: O a. $1, 100 O b. $1, 110 O C. $1, 145 O d. $1, 148Question 7 The following table shows the quantify sold and corresponding prices of all goods in a simple economy. The real GDP in 2019, expressed in 2018 prices Not yet was answered Marked out of 1.00 Flag question 2018 Price Quantity Good A $1.00 250 Good B $2.00 175 Good C $5.00 100 2019 Price Quantity Good A $1.05 260 Good B $1.90 200 Good C $5.50 90 Select one: O a. $1,100 O b. $1, 110 O c. $1, 145 O d. $1,148Question 8 The following table shows the quantify sold and corresponding prices of all goods in a simple economy. The growth rate of real GDP in this country Not yet between 2018 and 2019, using 2018 as the base year is answered Marked out of 1.00 Flag question 2018 Price Quantity Good A $1.00 250 Good B $2.00 175 Good C $5.00 100 2019 Price Quantity Good A $1.05 260 Good B $1.90 200 Good C $5.50 90 Select one: O a. 0.9% O b. 3.4% O C. 10% O d. 38%
Step by Step Solution
There are 3 Steps involved in it

Get step-by-step solutions from verified subject matter experts