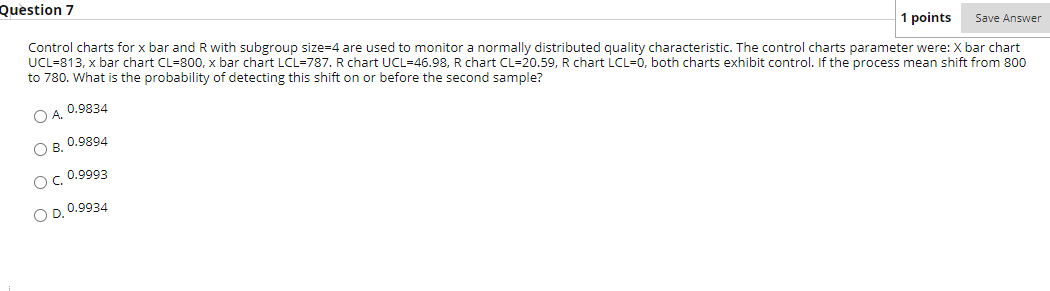
Question: Question 7 1 points Save Answer Control charts for x bar and R with subgroup size=4 are used to monitor a normally distributed quality characteristic.

Question 7 1 points Save Answer Control charts

Question 7 1 points Save Answer Control charts for x bar and R with subgroup size=4 are used to monitor a normally distributed quality characteristic. The control charts parameter were: X bar chart UCL=813, x bar chart CL=800, x bar chart LCL-787. R chart UCL=46.98, R chart CL=20.59, R chart LCL=0, both charts exhibit control. If the process mean shift from 800 to 780. What is the probability of detecting this shift on or before the second sample? 0.9834 OB 0.9894 O c 0.9993 OD. 0.9934

Step by Step Solution

There are 3 Steps involved in it

1 Expert Approved Answer
Step: 1 Unlock blur-text-image
Question Has Been Solved by an Expert!

Get step-by-step solutions from verified subject matter experts

Step: 2 Unlock
Step: 3 Unlock

Students Have Also Explored These Related General Management Questions!