

Question: Question 7 2 p t s This graph of expected sales level and expected output ( production ) shows: a level production plan is being
Question
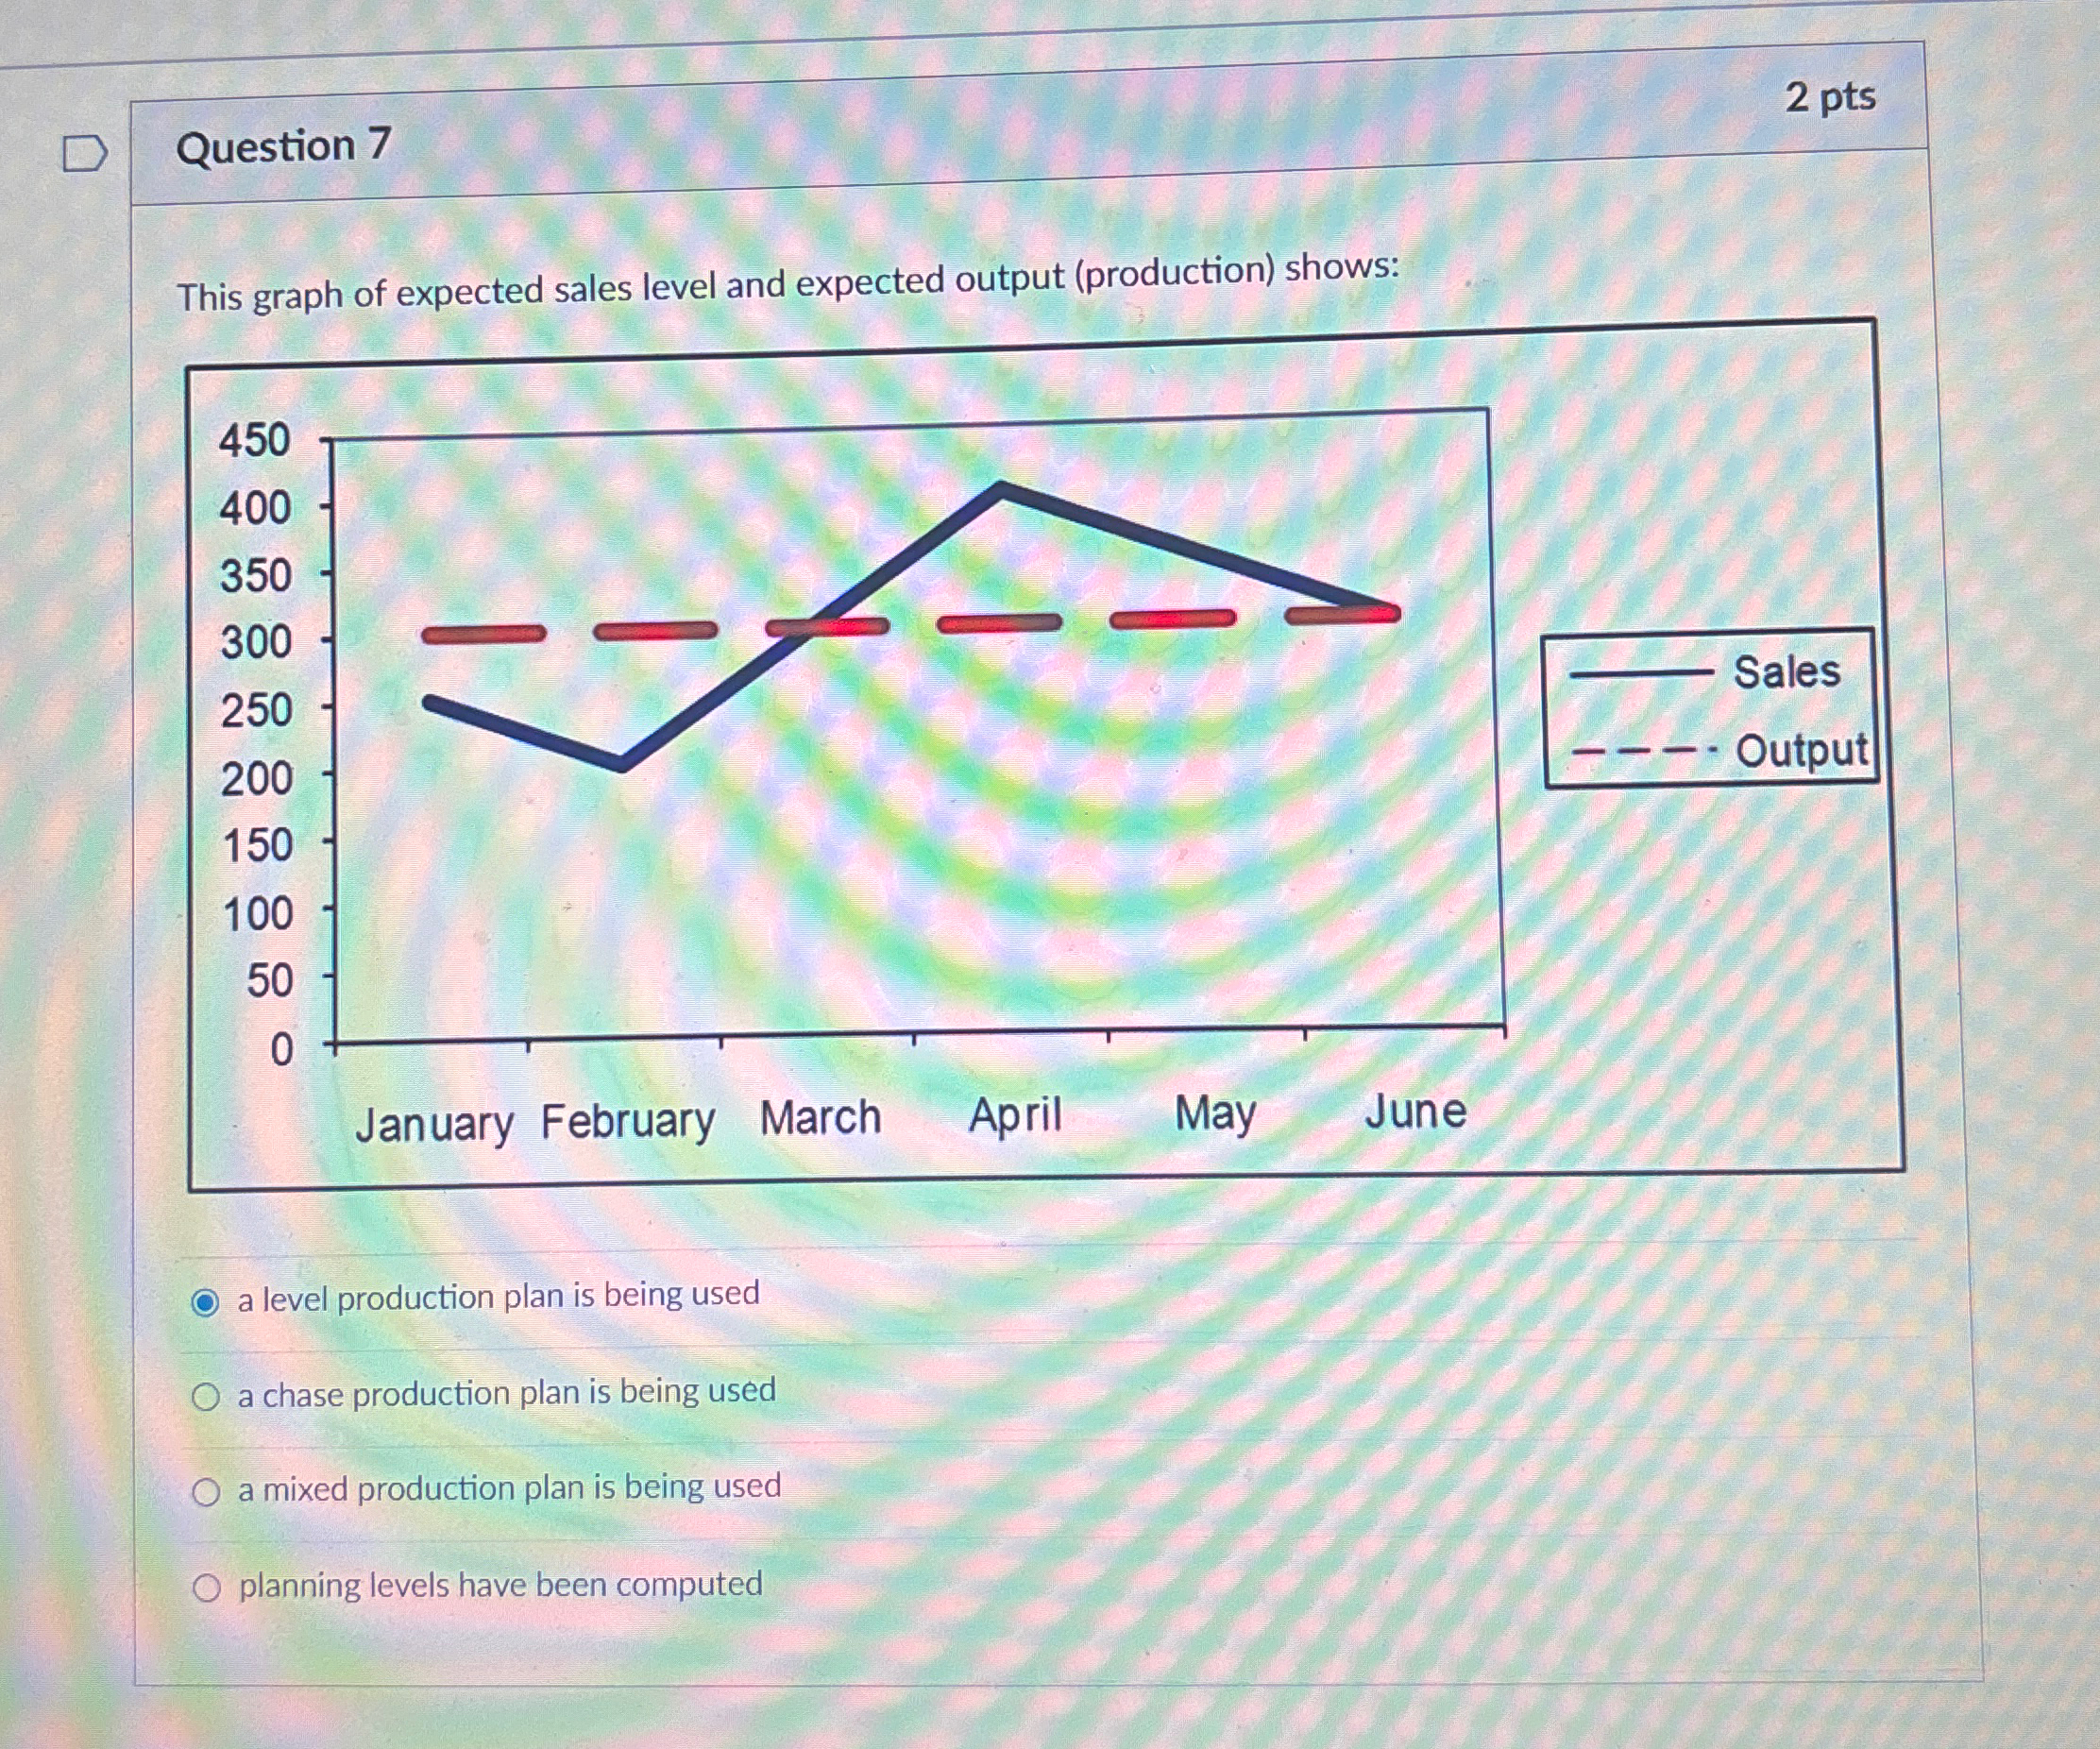
This graph of expected sales level and expected output production shows:
a level production plan is being used
a chase production plan is being used
a mixed production plan is being used
planning levels have been computed
Step by Step Solution
There are 3 Steps involved in it
1 Expert Approved Answer
Step: 1 Unlock

Question Has Been Solved by an Expert!
Get step-by-step solutions from verified subject matter experts
Step: 2 Unlock
Step: 3 Unlock