

Question: Question 7: 7. The probability distribution for the random variable x follows. X f (x) 20 .20 25 .15 30 .25 35 40 a. Is


Question 7:
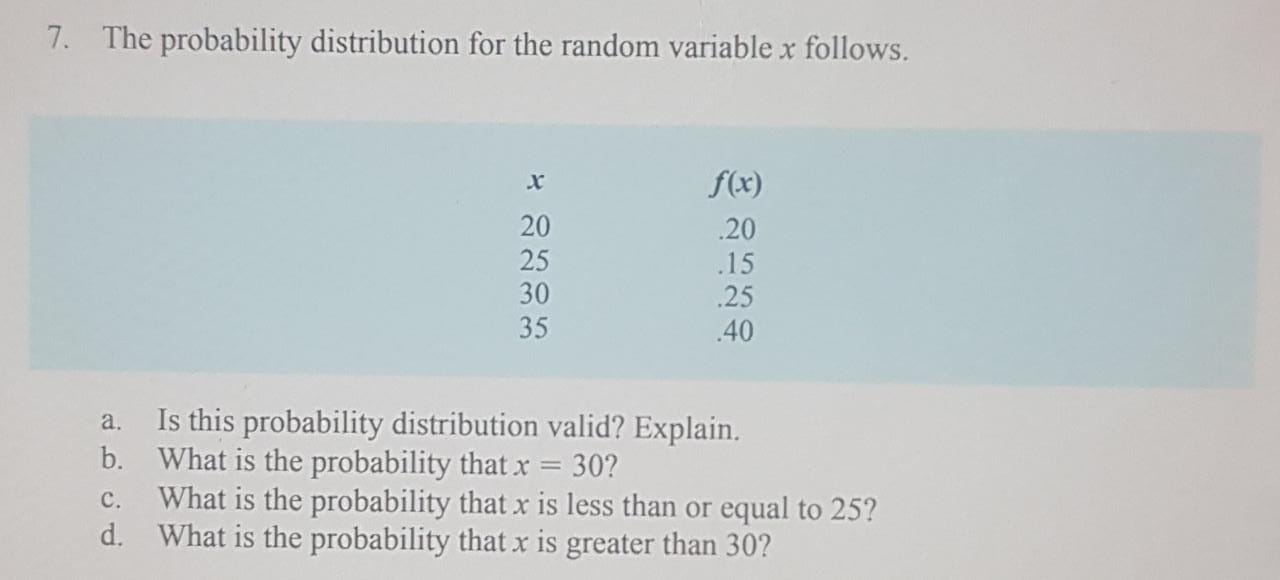
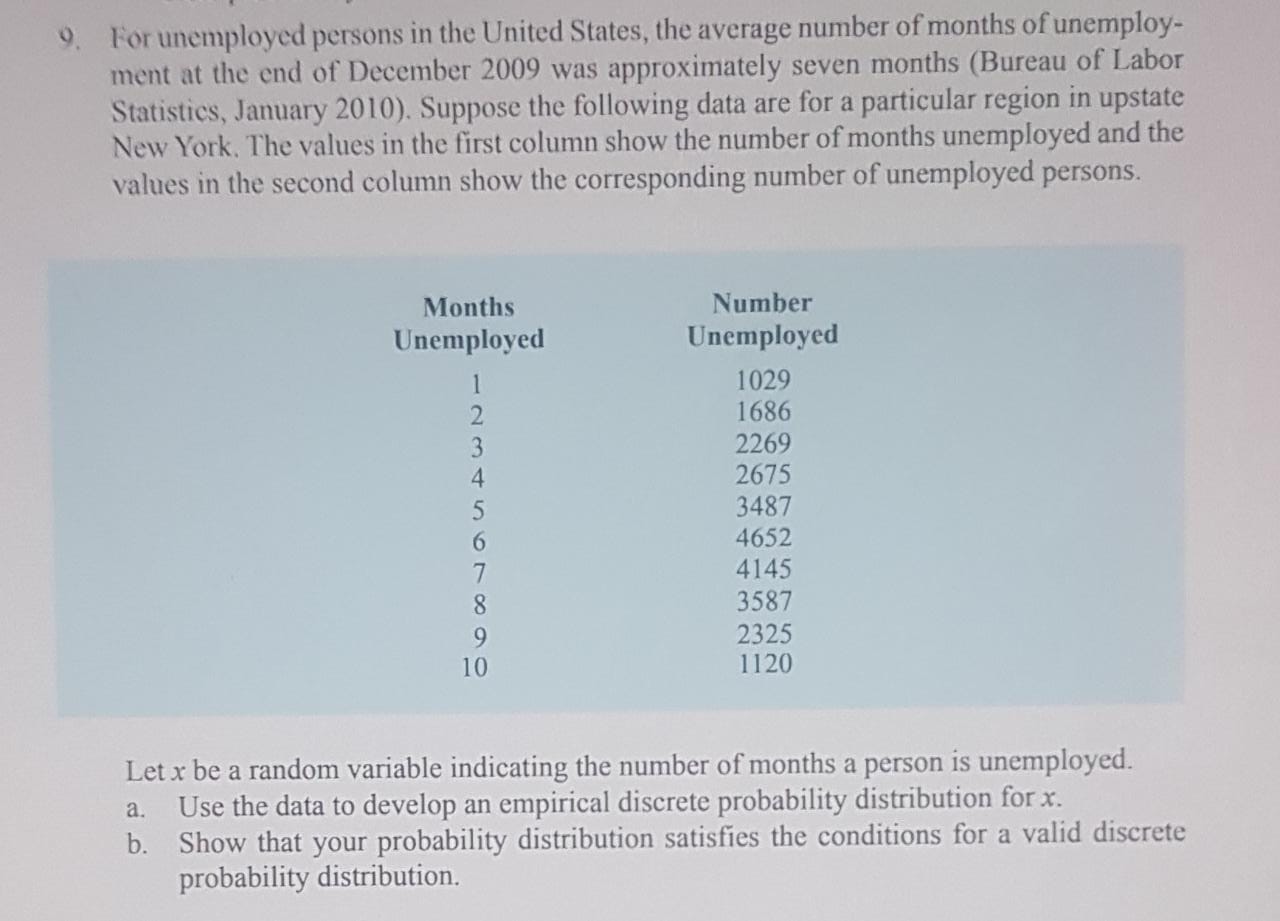


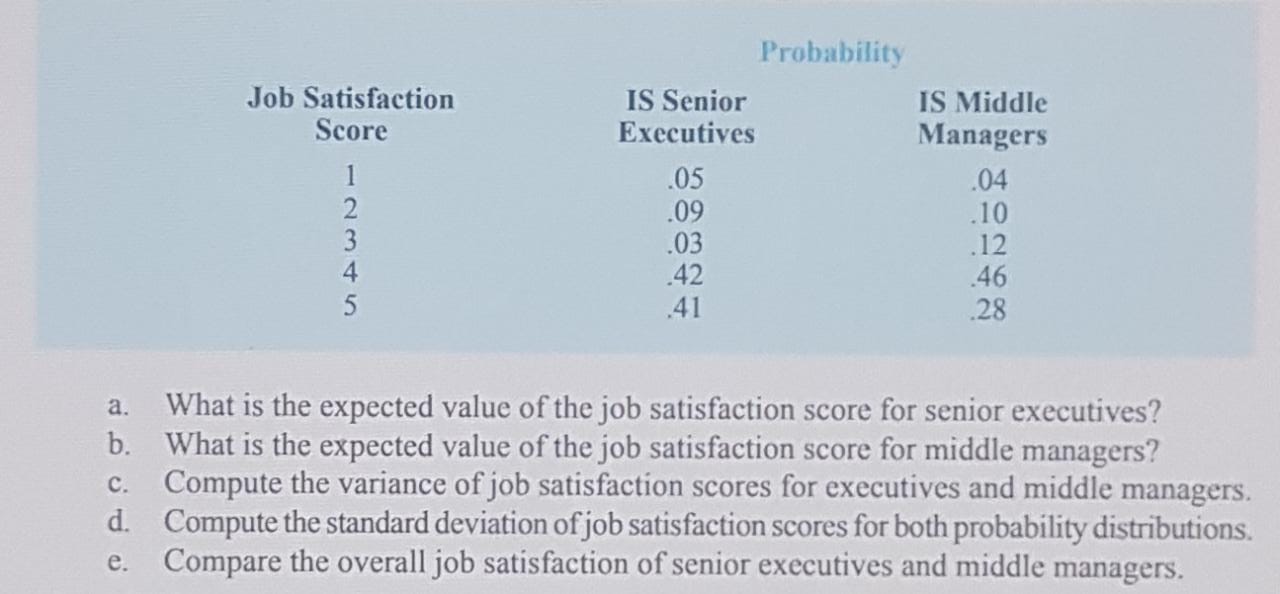
7. The probability distribution for the random variable x follows. X f (x) 20 .20 25 .15 30 .25 35 40 a. Is this probability distribution valid? Explain. b. What is the probability that x = 30? c. What is the probability that x is less than or equal to 25? d. What is the probability that x is greater than 30?9. For unemployed persons in the United States, the average number of months of unemploy- ment at the end of December 2009 was approximately seven months (Bureau of Labor Statistics, January 2010). Suppose the following data are for a particular region in upstate New York. The values in the first column show the number of months unemployed and the values in the second column show the corresponding number of unemployed persons. Months Number Unemployed Unemployed 1029 1686 2269 2675 3487 Ob 0 V auAWN - 4652 4145 3587 2325 1120 Let x be a random variable indicating the number of months a person is unemployed. a. Use the data to develop an empirical discrete probability distribution for x. b. Show that your probability distribution satisfies the conditions for a valid discrete probability distribution.c. What is the probability that a person is unemployed for two months or less? Unem- ployed for more than two months? d. What is the probability that a person is unemployed for more than six months?21. The following probability distributions of job satisfaction scores for a sample of information systems (IS) senior executives and middle managers range from a low of 1 (very dissatisfied) to a high of 5 (very satisfied).Probability Job Satisfaction IS Senior IS Middle Score Executives Managers 05 .04 .09 .10 UI AWN- .03 .12 .42 .46 41 28 a. What is the expected value of the job satisfaction score for senior executives? b. What is the expected value of the job satisfaction score for middle managers? c. Compute the variance of job satisfaction scores for executives and middle managers. d. Compute the standard deviation of job satisfaction scores for both probability distributions. e. Compare the overall job satisfaction of senior executives and middle managers
Step by Step Solution
There are 3 Steps involved in it

Get step-by-step solutions from verified subject matter experts