

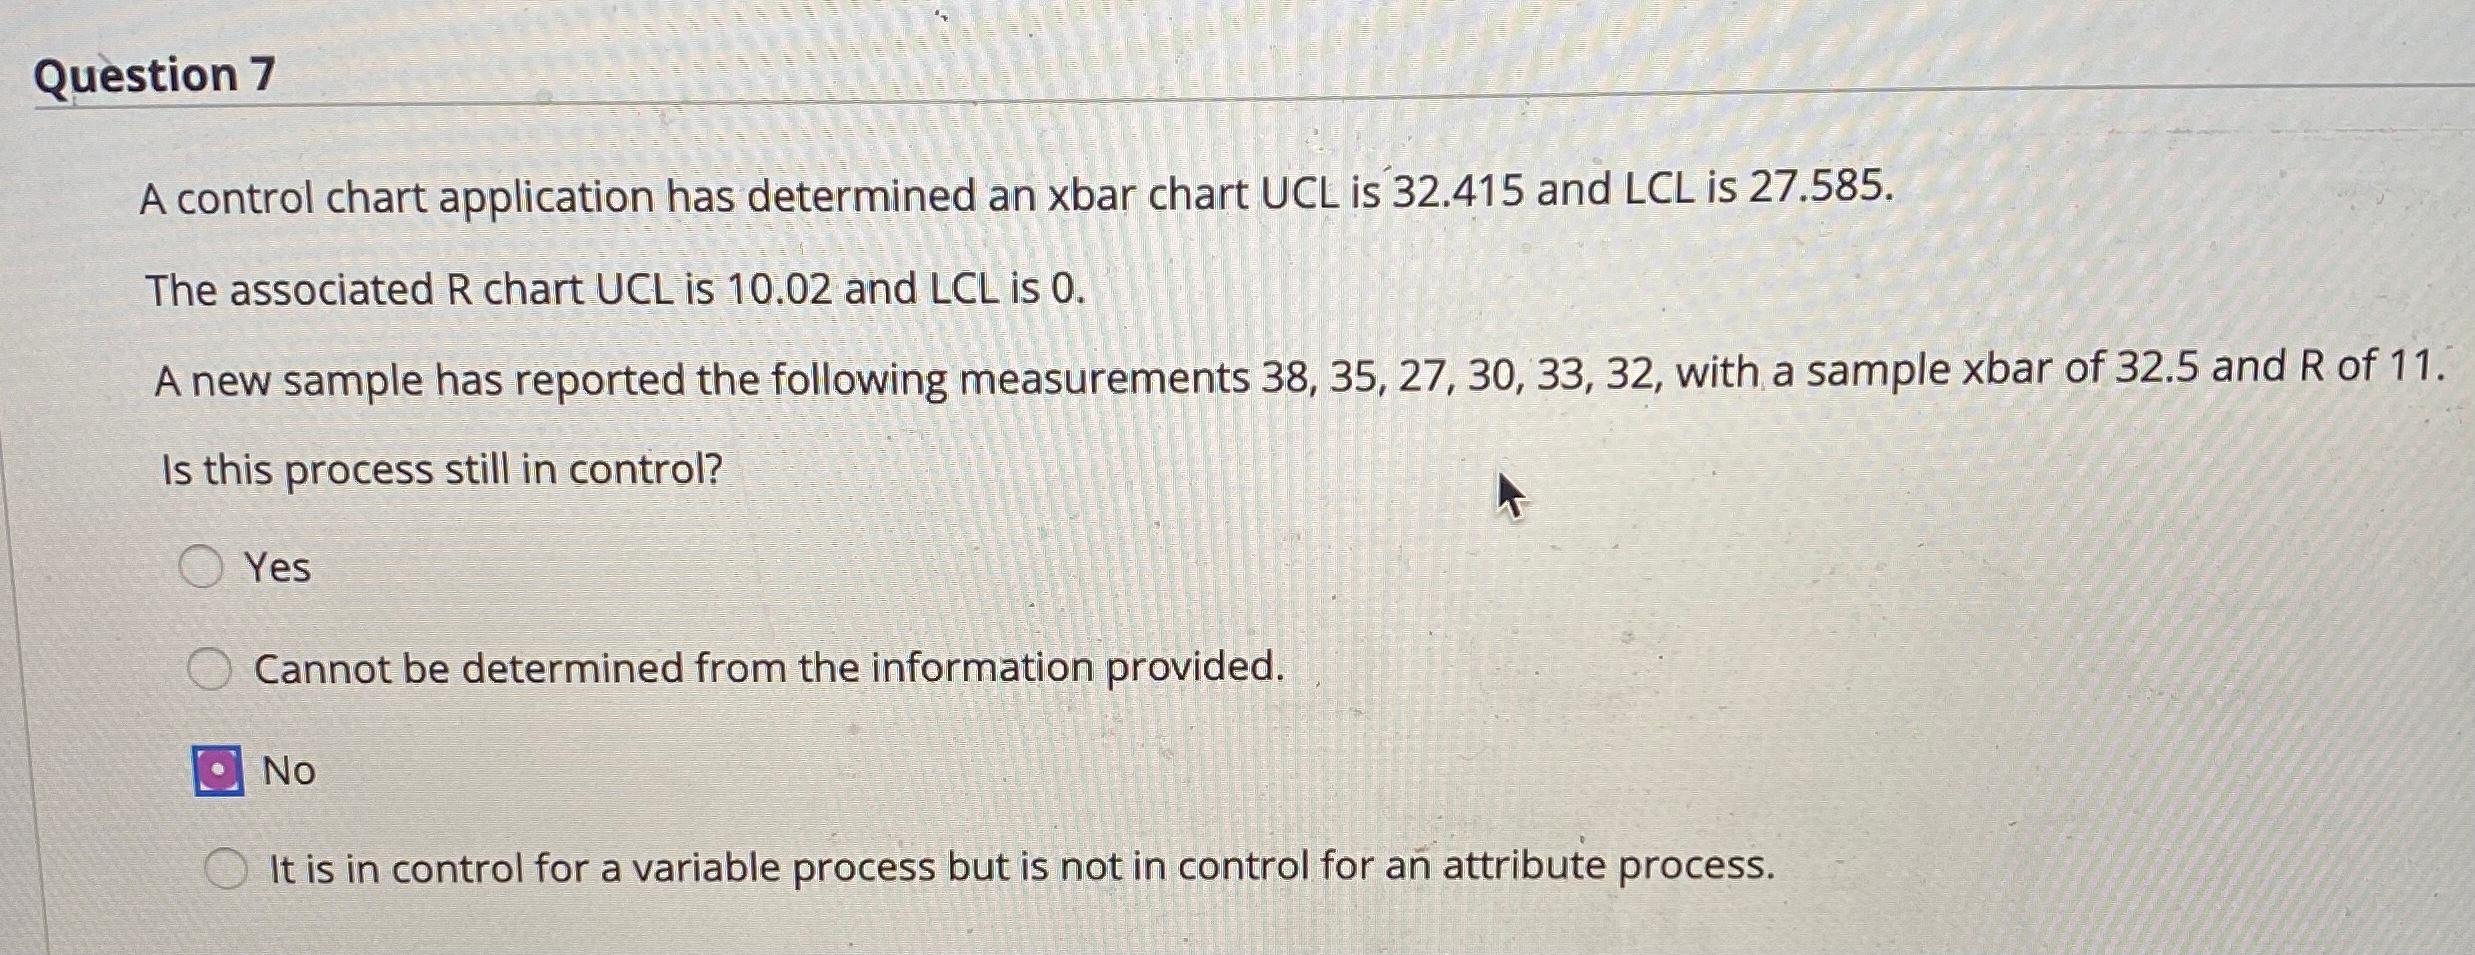
Question: Question 7 A control chart application has determined an xbar chart UCL is 32.415 and LCL is 27.585. The associated R chart UCL is 10.02
Step by Step Solution
There are 3 Steps involved in it
1 Expert Approved Answer
Step: 1 Unlock

Question Has Been Solved by an Expert!
Get step-by-step solutions from verified subject matter experts
Step: 2 Unlock
Step: 3 Unlock