

Question: Question 7 Given the two data sets: SET A: { 5, 7, 9, 11. 13 ) and SET B: ( 5, 9, 9, 10,12), which
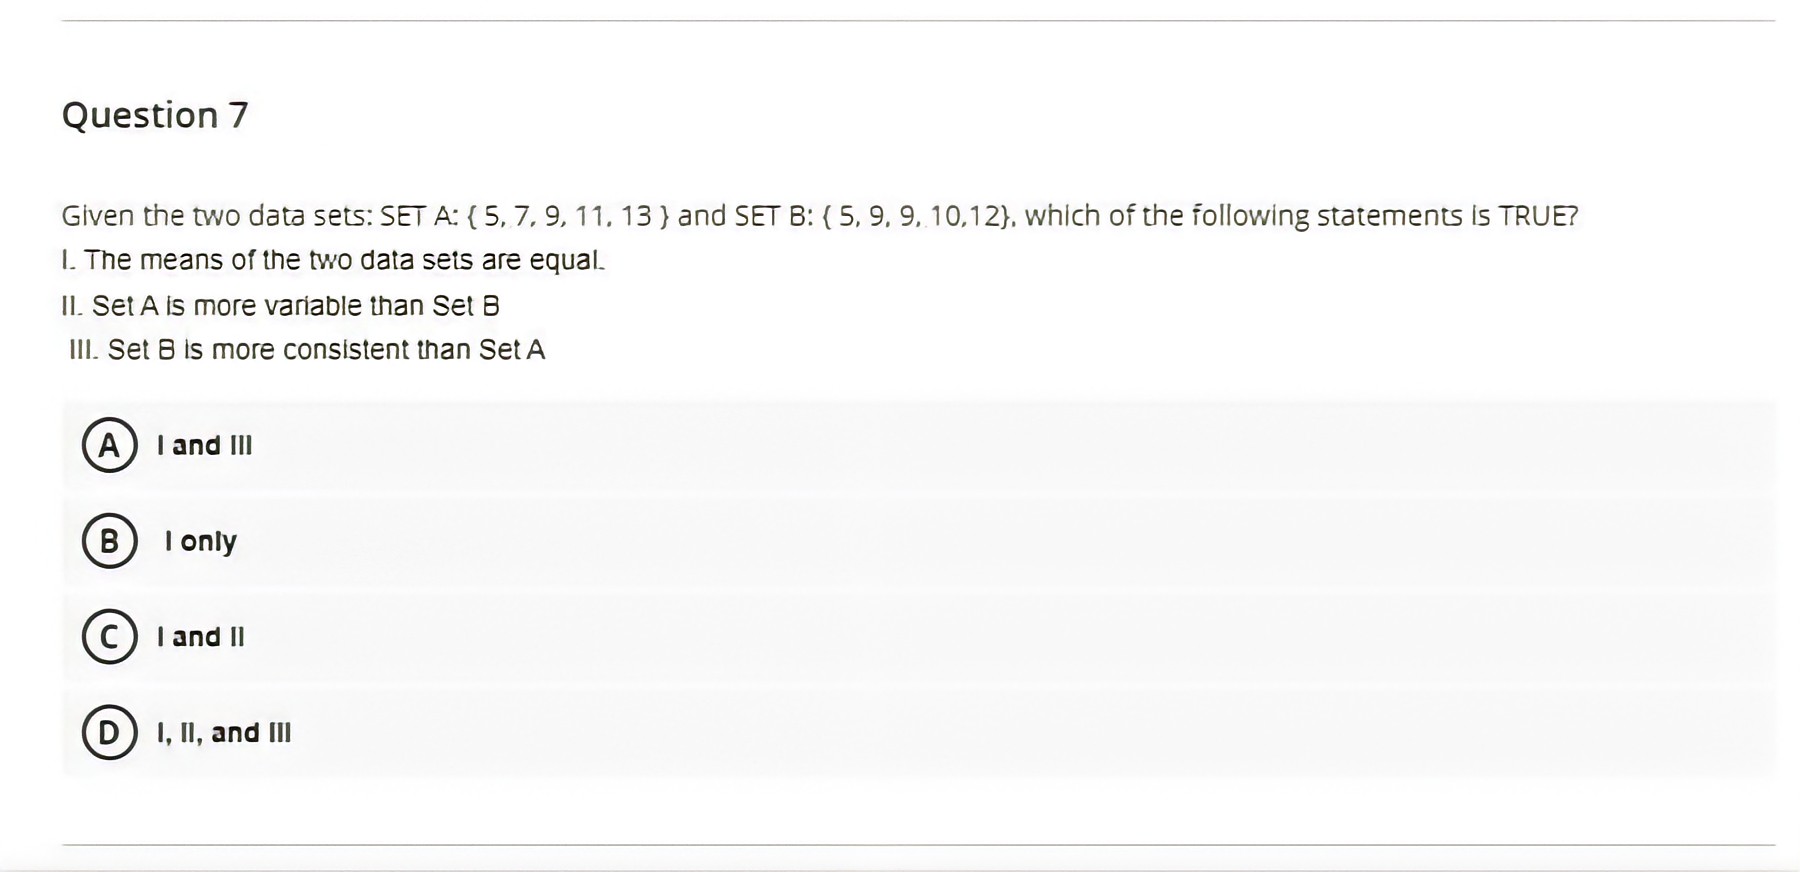


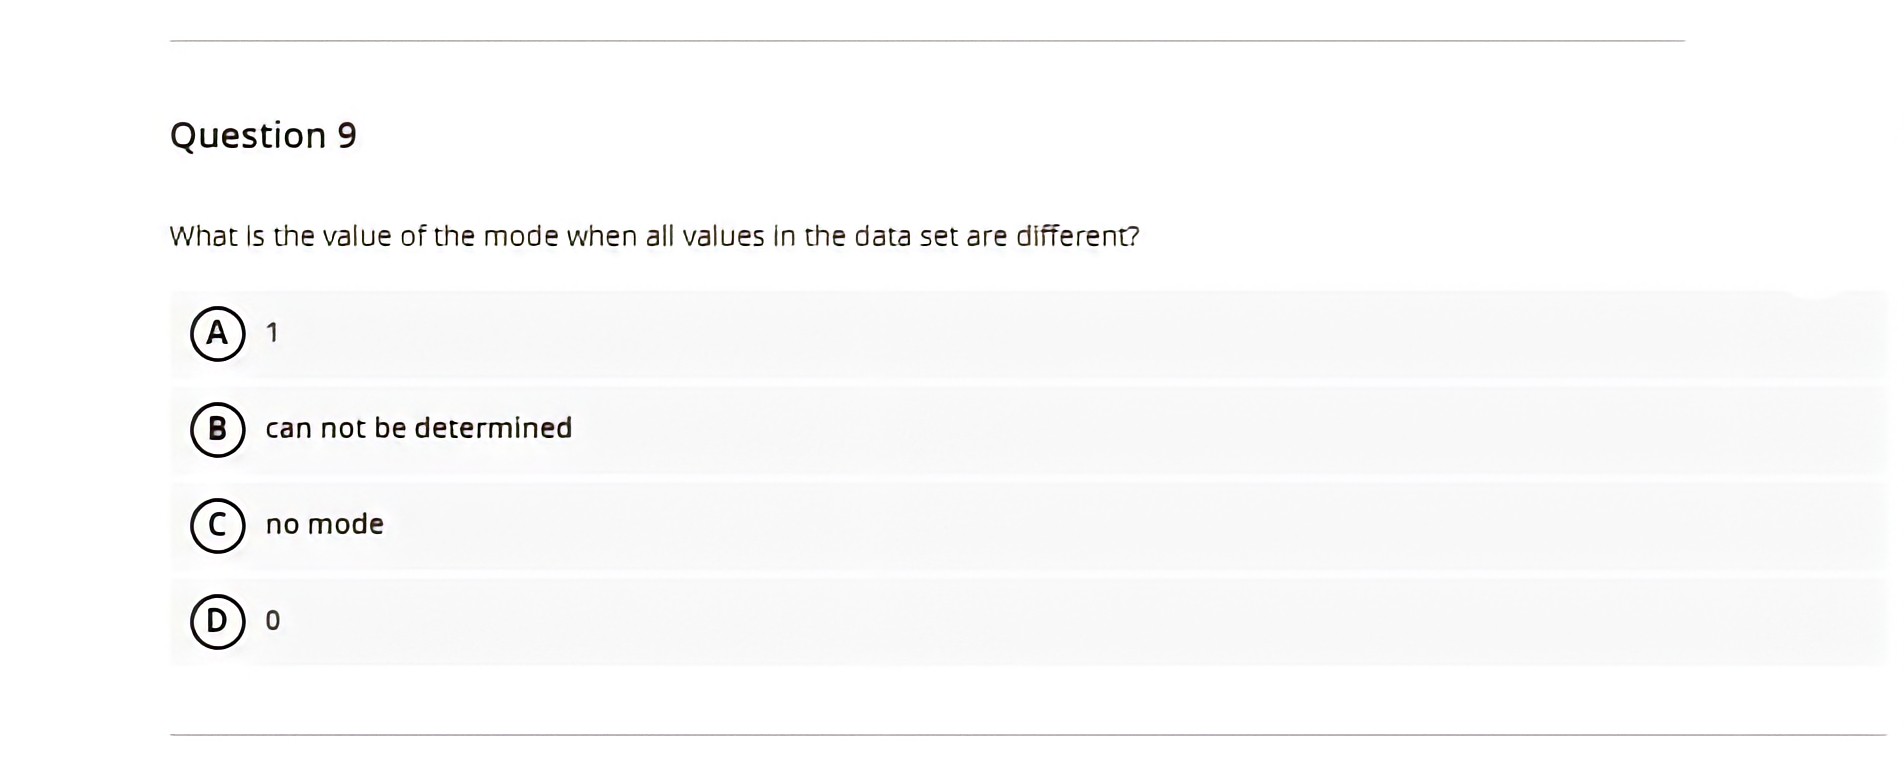

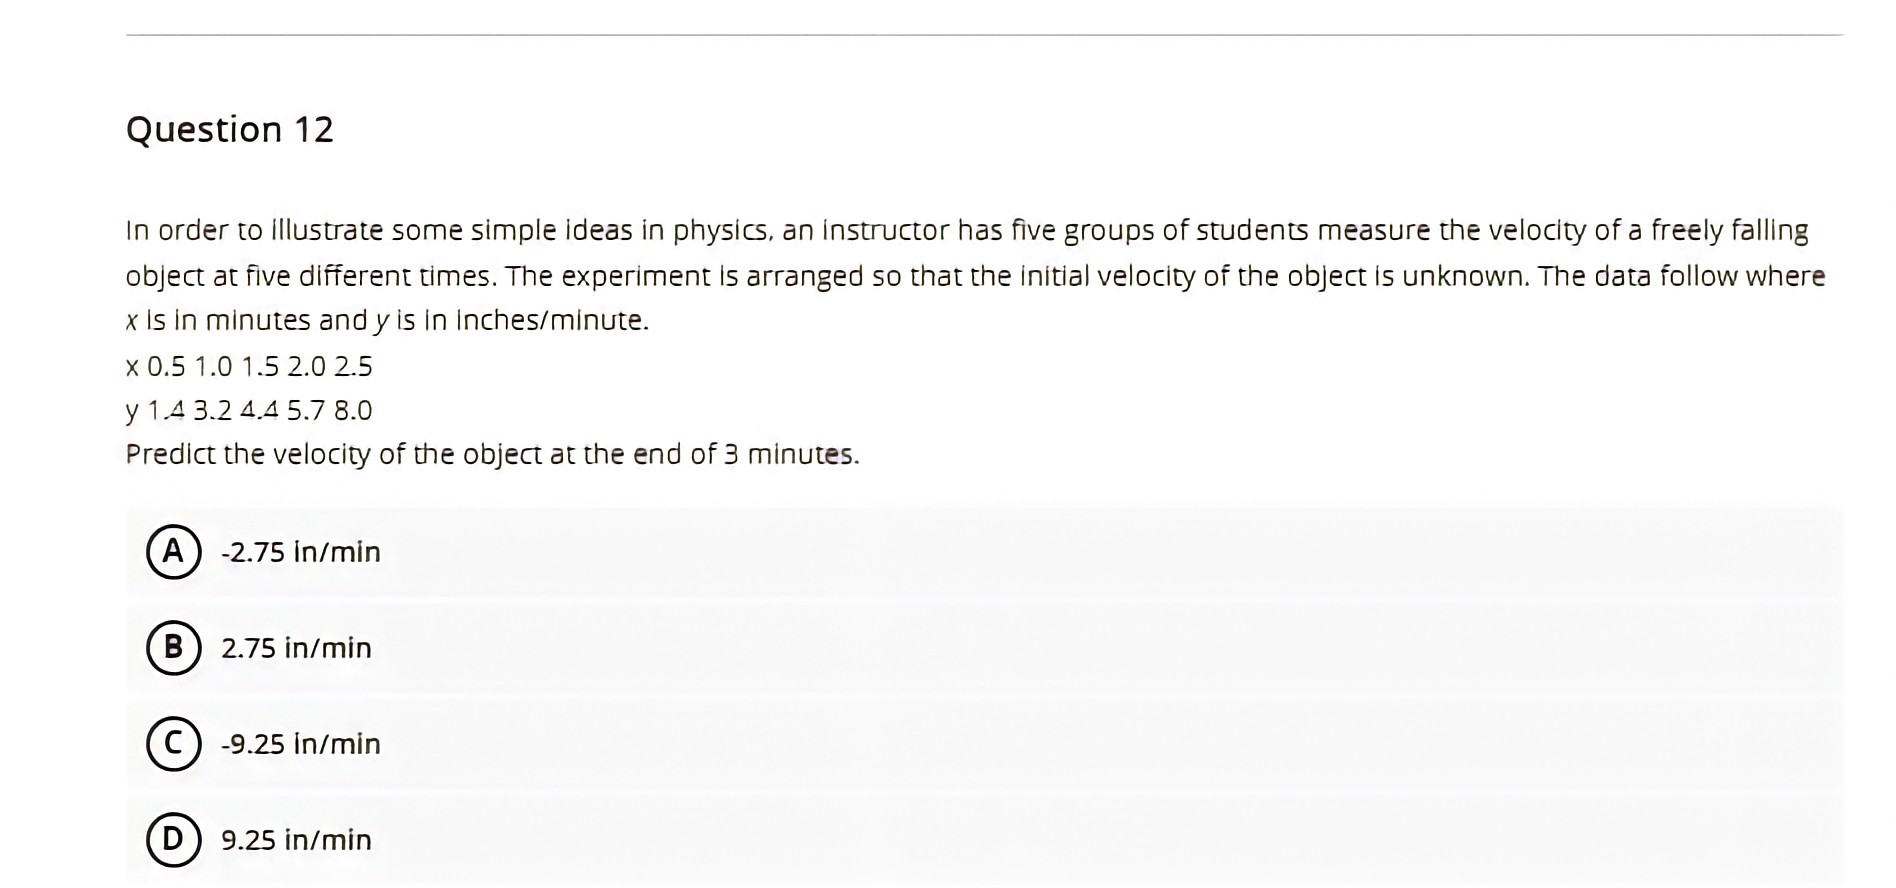

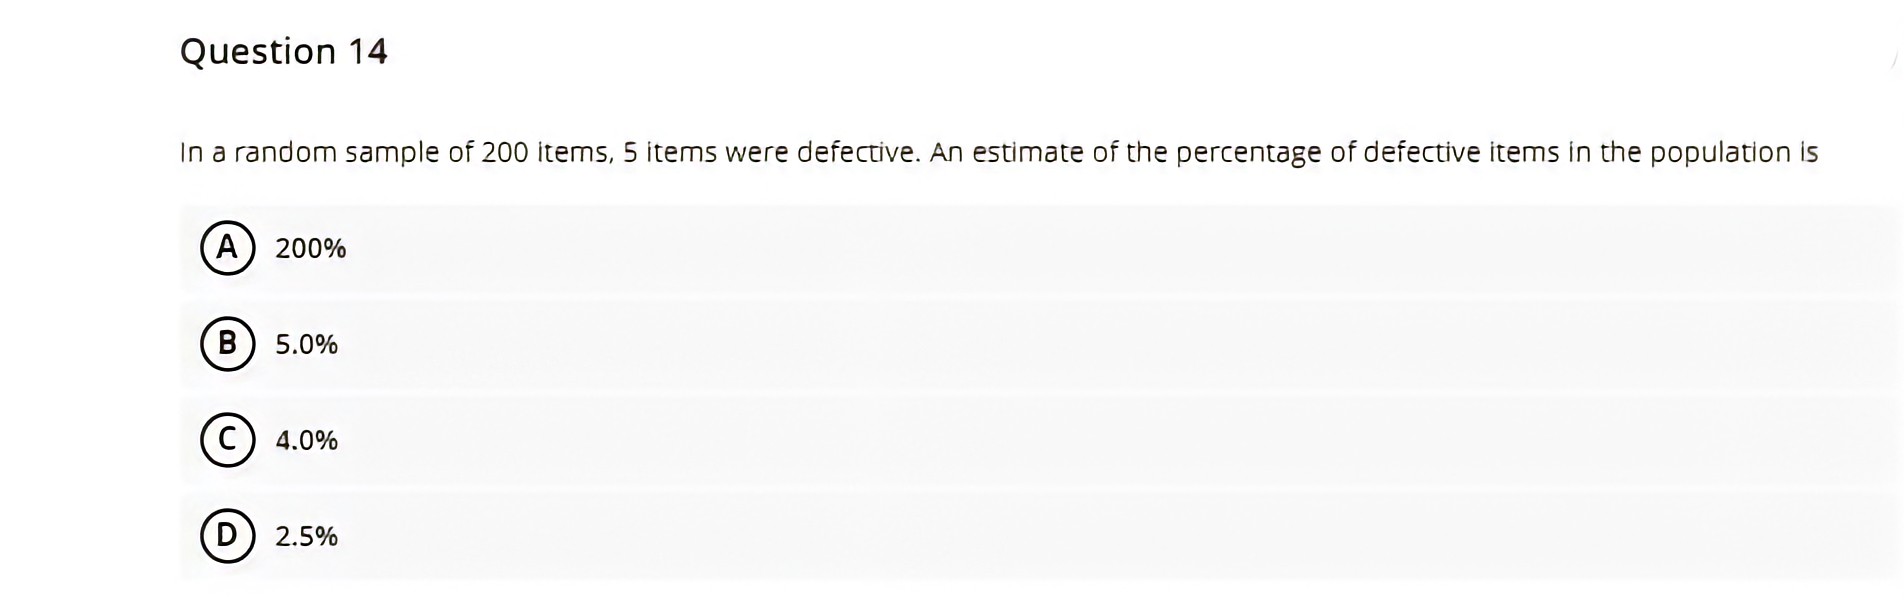
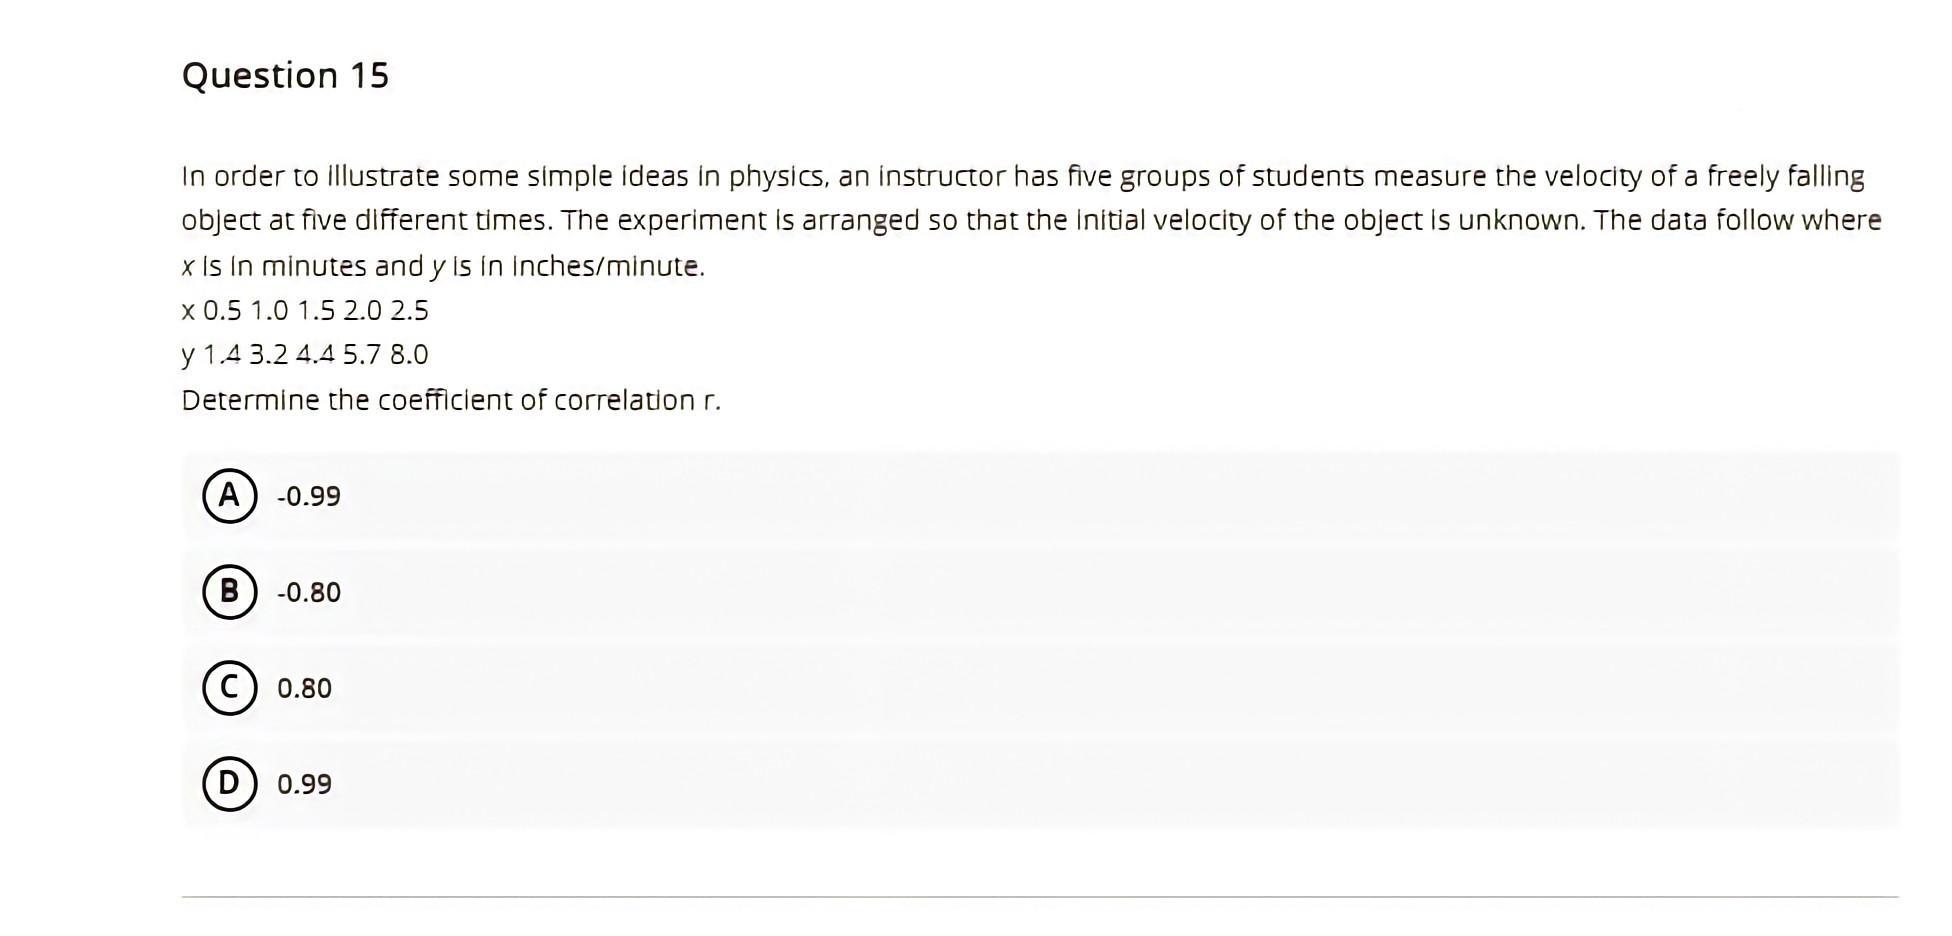


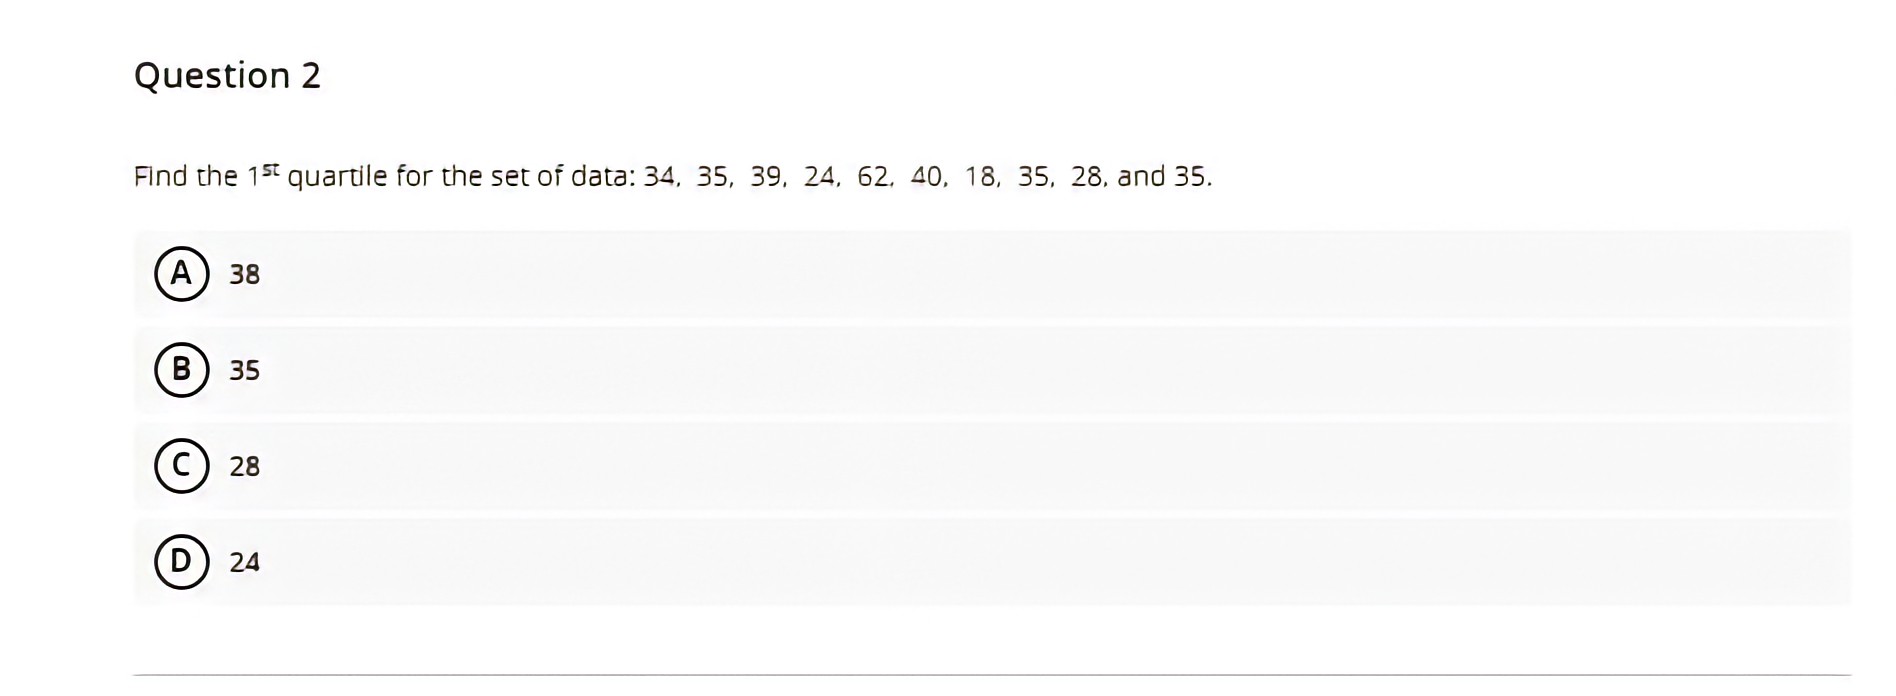
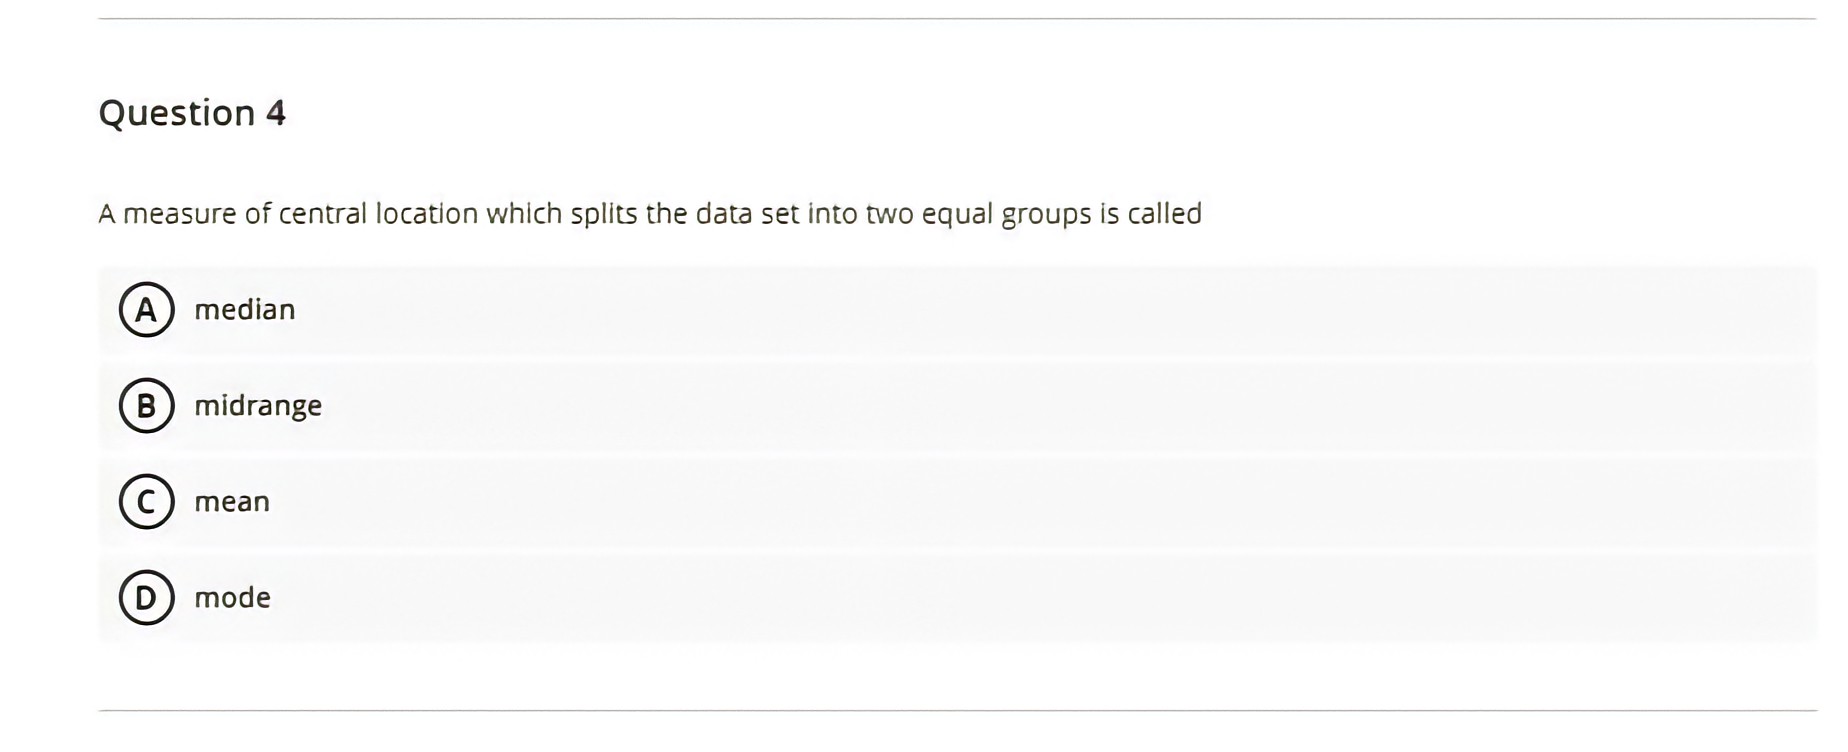
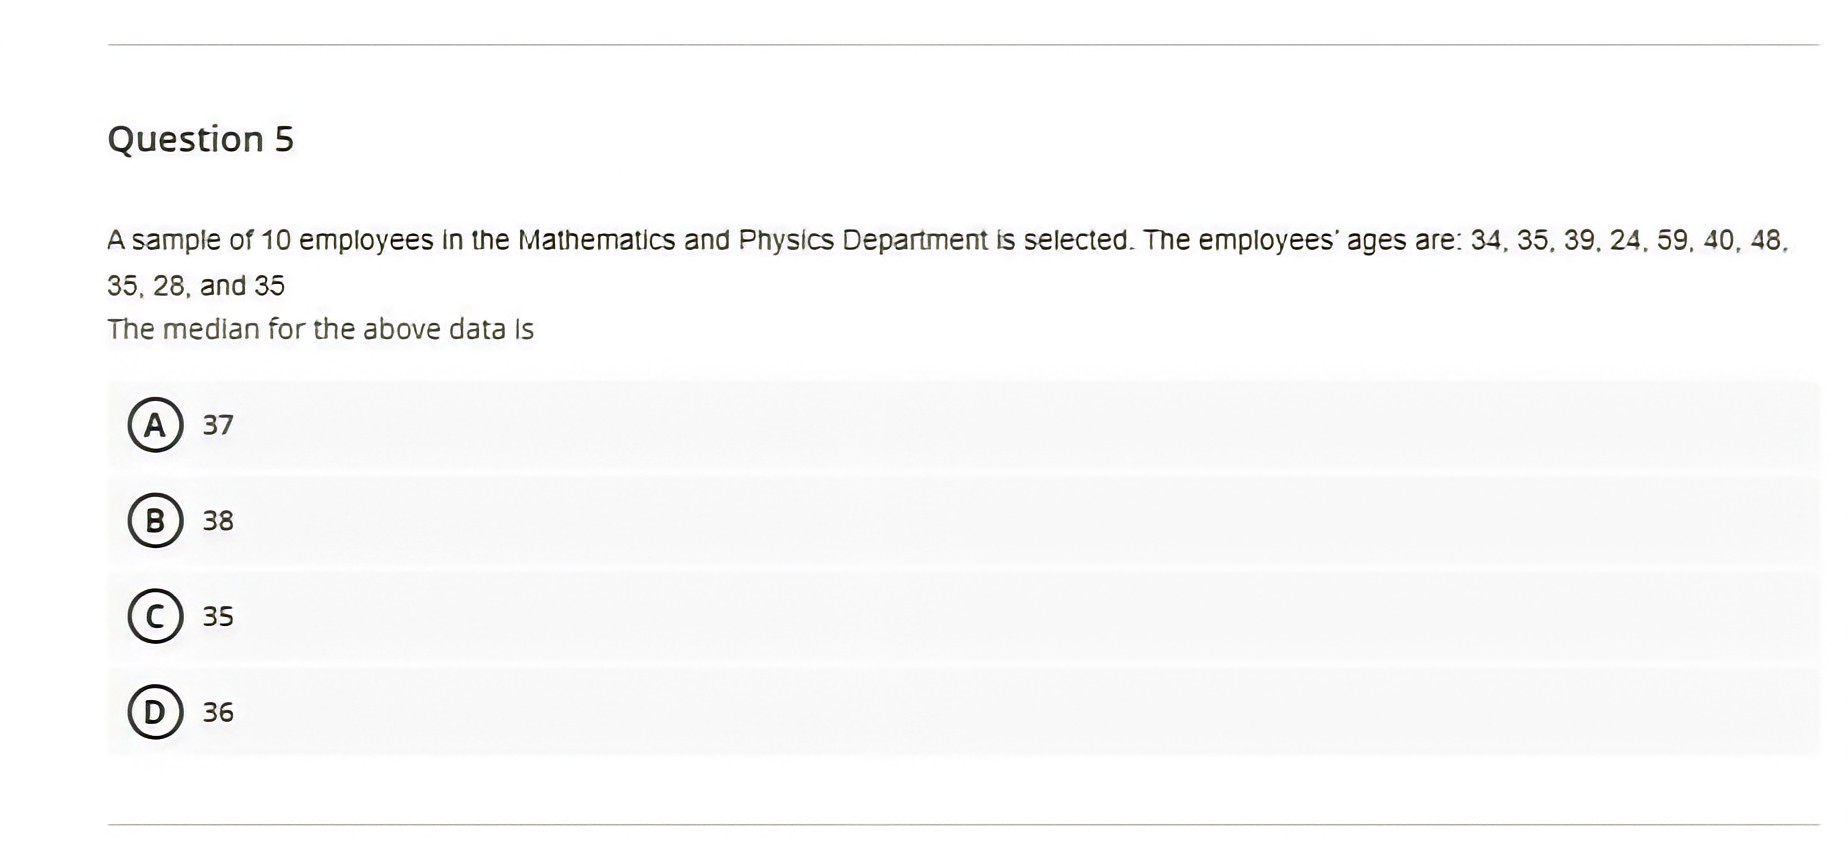
Question 7 Given the two data sets: SET A: { 5, 7, 9, 11. 13 ) and SET B: ( 5, 9, 9, 10,12), which of the following statements is TRUE? 1. The means of the two data sets are equal. II. Set A is more variable than Set B Ill. Set B is more consistent than Set A A I and Ill B I only I and II D I, II, and IllQuestion 9 What Is the value of the mode when all values in the data set are different? A B can not be determined no mode D 0Question 10 The number of absences per year that a worker has ls an example of what type of data? 69 qualitative continuous \fQuestion 12 In order to illustrate some simple ideas in physics, an instructor has five groups of students measure the velocity of a freely falling object at five different times. The experiment is arranged so that the initial velocity of the object is unknown. The data follow where x Is in minutes and y is in Inches/minute. x 0.5 1.0 1.5 2.0 2.5 y 1.4 3.2 4.4 5.7 8.0 Predict the velocity of the object at the end of 3 minutes. A -2.75 in/min B 2.75 in/min -9.25 in/min D 9.25 in/minQuestion 13 What do you cell a sequence of payments made at equal time periods? Compound Interest Question 14 In a random sample of 200 items, 5 items were defective. An estimate of the percentage of defective items in the population is A 200% B 5.0% 4.0% D 2.5%Question 15 In order to illustrate some simple ideas in physics, an instructor has five groups of students measure the velocity of a freely falling object at five different times. The experiment is arranged so that the Initial velocity of the object is unknown. The data follow where x Is In minutes and y is in Inches/minute. x 0.5 1.0 1.5 2.0 2.5 y 1.4 3.2 4.4 5.7 8.0 Determine the coefficient of correlation r. A -0.99 B -0.80 0.80 D 0.99Question 16 The study of the methods of organization, summarization and presentation of statistical data is called A inferential statistics B random sample sampling D descriptive statisticsQuestion 17 If the value of the kurtosis Is greater than 0, then the distribution is A platykurtic B mesokurtic C normal D leptokurticQuestion 19 A statistic that tells the number of standard deviations a data value is above or below the mean is called A A z score B A quartile C A coefficient of variation D A percentileQuestion 20 The average value of a data set is called A midrange B median mode D meanQuestion 1 When data are categorized as. for example, places of residence (rural, suburban, urban) the most appropriate measure of central tendency is the A median B mean mode D midrangeQuestion 2 Find the 1st quartile for the set of data: 34, 35, 39, 24, 62, 40, 18, 35, 28, and 35. A 38 B 35 28 D 24Question 4 A measure of central location whlch splits the data set Into two equal groups is called Question 5 A sample of 10 employees in the Mathematics and Physics Department is selected. The employees' ages are: 34, 35, 39, 24, 59, 40, 48, 35, 28, and 35 The median for the above data Is A 37 B 38 35 D 36Question 6 Data that can be classified according to color are measured on what scale? A nominal B interval ratio D ordinal
Step by Step Solution
There are 3 Steps involved in it

Get step-by-step solutions from verified subject matter experts