

Question: Question : 7. How should Greystock modify his DCF analysis? 8. What is the Merseyside project worth to Victoria Chemicals? 9. What are the key
Question :
7. How should Greystock modify his DCF analysis?
8. What is the Merseyside project worth to Victoria Chemicals?
9. What are the key drivers of Merseyside projects valuation?
VICTORIA CHEMICALS PLC (A): THE MERSEYSIDE PROJECT
THE PROPOSED CAPITAL PROGRAM
Morris had assumed responsibility for the Merseyside Works only 12 months previously, following a rapid rise from an entry position of shift engineer nine years before. When she assumed responsibility, she undertook a detailed review of the operations and discovered significant opportunities for improvement in polypropylene production. Some of these opportunities stemmed from the deferral of maintenance over the preceding five years. In an effort to enhance the operating results of the Works, the previous manager had limited capital expenditures to only the most essential. Now, what had been routine and deferrable was becoming essential. Other opportunities stemmed from correcting the antiquated plant design in ways that would save energy and improve the process flow: (1) relocating and modernizing tank-car unloading areas, which would enable the process flow to be streamlined; (2) refurbishing the polymerization tank to achieve
higher pressures and thus greater throughput; and (3) renovating the compounding plant to increase extrusion throughput and obtain energy savings.
Morris proposed the expenditure of GBP12 million on this program. The entire polymerization line would need to be shut down for 45 days, however, and because the Rotterdam plant was operating near capacity, Merseysides customers would buy from competitors. Greystock believed the loss of customers would not be permanent. The benefits would be a
lower energy requirement as well as a 7% greater manufacturing throughput. In addition, the project was projected to improve gross margin (before depreciation and energy savings) from 11.5% to 12.5%. The engineering group at Merseyside was highly confident that the efficiencies would be realized.
Merseyside currently produced 250,000 metric tons of polypropylene pellets a year. Currently, the price of polypropylene averaged GBP675 per ton for Victoria Chemicals? product mix. The tax rate required in capital-expenditure analyses was 30%. Greystock discovered that any plant facilities to be replaced had been completely depreciated. New assets could be depreciated on an accelerated basis over 15 years, the expected life of the assets. The increased throughput would necessitate a one-time increase of work-in-process inventory equal in value to 3.0% to cost of goods. Greystock included in the first year of his forecast preliminary engineering costs of GBP500,000, which had been spent over the preceding nine months of efficiency and design studies of the renovation. Finally, the corporate manual stipulated that overhead costs be reflected in project analyses at the rate of 3.5% times the book value of assets acquired in the project, per year.
Greystock had produced the discounted-cash-flow summary given in Exhibit 2. It suggested that the capital program would easily hurdle Victoria Chemicals? required return of 10% of engineering projects.
CONCERNS OF THE TRANSPORT DIVISION
Victoria Chemicals owned the tank cars with which Merseyside received propylene gas from four petroleum refineries in England. The Transport Division, a cost center, oversaw the movement of all raw,
intermediate, and finished materials throughout the company and was responsible for managing the tank cars. Because of the projects increased throughput, Transport would have to increase its allocation
of tank cars to Merseyside.
Currently, the Transport Division could make this allocation out of excess capacity, although doing so would accelerate from 2012 to 2010 the need to purchase new rolling stock to support anticipated growth of the firm in other areas. The purchase would cost GBP2 million. The rolling stock would have a depreciable life of 10 years, but with proper maintenance, the cars could operate much longer. The rolling stock could not be used outside of Britain because of differences in track gauge.
A memorandum from the controller of the Transport Division suggested that the cost of these tank cars should be included in the initial outlay Merseysides capital program. But Greystock disagreed. He told Morris
The Transport Division isnt paying one pence of actual cash because of what were doing at Merseyside. In fact, were doing the company a favor in using its excess capacity. Even if an allocation has to be
made somewhere, it should go on the Transport Divisions books. The way weve always evaluated projects in this company has been with the philosophy of every tub on its own bottom ---every division has to fend for itself. The Transport Division isnt part of our own Intermediate Chemicals Group, so they should carry the allocation of rolling stock.
Accordingly, Greystock had not reflected any charge for the use of excess rolling stock in his preliminary DCF analysis, given in Exhibit 2.
The Transport Division and Intermediate Chemicals Group reported to separate executive vice presidents, who reported to the chairman and chief executive officer of the company. The executive VPs received an annual incentive bonus pegged to the performance of their division
CONCERNS OF THE ICG SALES AND MARKETING DEPARTMENT
Greystocks analysis had let to questions from the director of Sales. In a recent meeting, the director told Greystock.
Your analysis assumes that we can sell the added output and thus obtain the full efficiencies from the project, but as you know, the market for polypropylene is extremely competitive. Right now, the
industry is in a downturn and it looks like an oversupply is in the works. This means that we will probably have to shift capacity away from Rotterdam toward Merseyside in order to move the added volume. Is this really a gain for Victoria Chemicals? Why spend money just so one plant can cannibalize another?
The vice president of Marketing was less skeptical. He said that with lower costs at Merseyside, Victoria Chemicals might be able to take business from the plants of competitors such as Saone-Poulet or
Vaysol. In the current severe recession, competitors would fight hard to keep customers, but sooner or later, the market would revive, and it would be reasonable to assume that any lost business volume would
return at that time.
Greystock had listened to both the director and vice president and chose to reflect no charge for the loss of business at Rotterdam in hi preliminary analysis of the Merseyside project. He told Morris.
Cannibalization really isnt a cash flow; there is no check written in this instance. Anyway, if the company starts burdening its cost-reduction projects with fictitious charges like this, well never maintain our cost competitiveness. A cannibalization charge is rubbish!
CONCERNS OF THE ASSISTANT PLANT MANAGER
Griffin Tewitt, the assistant plant manager and direct subordinate of Morris, proposed an unusual modification to Greystocks analysis during a late-afternoon meeting with Greystock and Morris. Over the past few months, Tewitt had been absorbed with the development of a proposal to modernize a separate and independent part of the Merseyside Works, the production line for ethylene-propylene-copolymer rubber (EPC). This product, a variety of synthetic rubber, had been pioneered by Victoria Chemicals in the early 1960s and was sold in bulk to European tire manufacturers. Despite hopes that this oxidation-resistant rubber would dominate the market in synthetics, in fact, EPC remained a relatively small product in the European chemical industry, Victoria, the largest supplier of EPC, produced the entire volume at Merseyside, EPC had been only marginally profitable to Victoria because of entry by competitors and the development of competing synthetic-rubber compounds over the past five years.
Tewitt had proposed a renovation of the EPC production line for a cost of GBP1 million. The renovation would give Victoria the lowest EPC cost base in the world and improve cash flows by GBP25,000 ad infinitum. Even so, at current prices and volumes, the net present value (NPV) of this project was --GBP750,000. Tewitt and the EPC product manager had argued strenuously to the executive committee of the company that the negative NPV ignored strategic advantages from the project and increases in volume and prices when the recession ended. Nevertheless, the executive committee had rejected the project, mainly on economic grounds.
CONCERNS OF THE TREASURY STAFF
After a meeting on a different matter, Frank Greystock described his dilemmas to Andrew Gowan, who worked as an analyst on Victoria Chemicals Treasury staff. Gowan scanned Greystocks analysis, and
pointed out that Cash flows and discount rate need to be consistent in their assumptions about inflation. The 10% hurdle rate youre using is a nominal target of return. The Treasury staff thinks this impounds a long-term inflation expectation of 3% per year. Thus, Victoria Chemicals? real (i.e., zero-inflation) target rate of return is 7%.
The conversation was interrupted before Greystock could gain a full understanding of Gowans comment. For the time being, Greystock decided to continue to use a discount rate of 10%, because it was the figure promoted in the latest edition of Victoria Chemicals capital-budgeting manual.
EVALUATING CAPITAL-EXPENDITURE PROPOSALS AT VICTORIA CHEMICALS
In submitting a project for senior-management approval, the project-initiators had to identify it as belonging to one of four possible categories: (1) new product or market, (2) product or market extension, (3) engineering efficiency, or (4) safety or environment. The first three categories of proposals were subject to a system of four performance hurdles, of which at least three had to be met for the proposal to be considered. The Merseyside project would be in the engineering efficiency category.
1. Impact on earnings per share: For engineering-efficiency projects, the contribution to net income from contemplated projects had to be positive. This criterion was calculated as the average annual EPS contribution of the project over its entire economic life, using the number of outstanding shares at the most recent fiscal year-end as the basis for the calculation. (At FYE 2000, Victoria Chemicals had 92,891, 240 shares outstanding.)
2. Payback: This criterion was defined as the number of years necessary for free cash flow of the project to amortize the initial project outlay completely. For engineering-efficiency projects, the maximum payback period was six years.
3. Discounted cash flow: DCF was defined as the present value of future cash flows of the project (at the hurdle rate of 10% for engineering-efficiency proposals), less the initial investment outlay. This net present value of free cash flows had to be positive.
4. Internal rate of return: IRR was defined as being that discount rate at which the present value of future free cash flows just equaled the initial outlay---in other words, the rate at which the NPV was 0. The IRR of engineering-efficiency projects had to be greater than 10%.
CONCLUSION
Morris wanted to review Greystocks analysis in detail and settle the questions surrounding the tank cars and potential loss of business volume at Rotterdam. As Greystocks analysis now stood, the Merseyside project met all four investment criteria:
1. Average annual addition to EPS = GBP0.022
2. Payback period = 3.8 years
3. Net present value = GBP10.6 million
4. Internal rate of return = 24.3%
Morris was concerned that further tinkering might seriously weaken the attractiveness of the project.
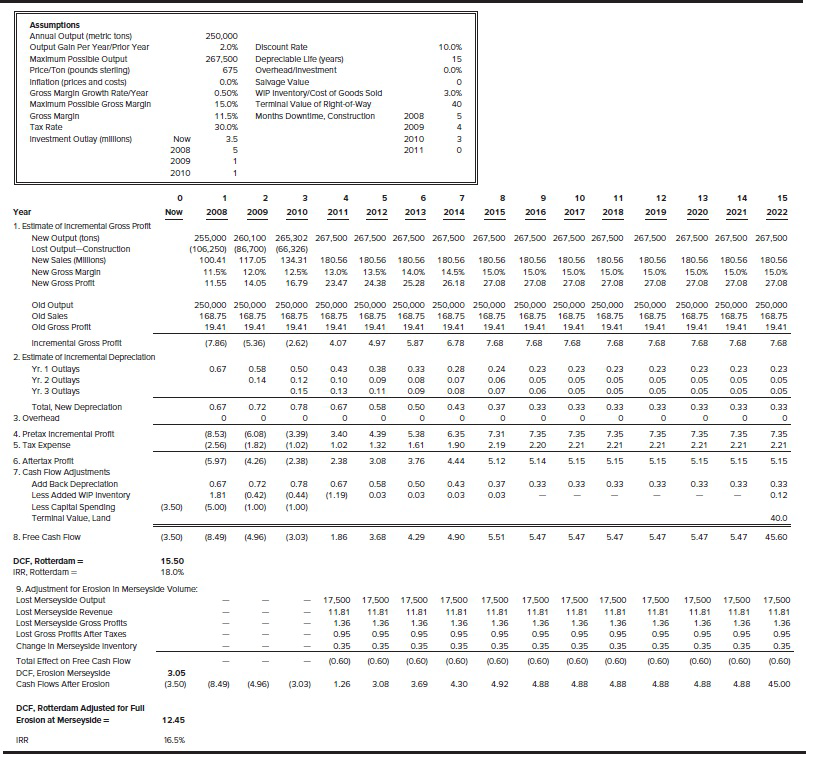
Assumptions Annual Output (metric tons) Output Gain Per Year/Prior Year Maximum Possible Output Price/Ton (pounds sterling) Inflation (prices and costs) Gross Margin Growth Rate/Year Maximum Possible Gross Margin Gross Margin Tax Rate Investment Outlay millions) 250,000 2.0% 267,500 675 0.0% 0.50% 15.0% 11.5% 30.0% 3.5 5 1 1 Discount Rate Depreciable Life (years) Overhead/Investment Salvage Value WIP Inventory/Cost of Goods Sold Terminal Value of Right-of-Way Months Downtime, Construction 10.0% 15 0.0% 0 3.0% 40 5 4 2008 2009 2010 2011 OW Now 2008 2009 2010 0 2 3 6 13 14 5 2012 7 2014 9 2016 10 2017 11 2018 12 2019 15 2022 Now 2008 2009 2010 2011 2013 2015 2020 2021 267,500 267,500 267,500 267,500 Year 1. Estimate of incremental Gross Profit New Output tons) Lost Output-Construction New Sales Millions) New Gross Margin New Gross Pront 255,000 260,100 265,302 267,500 267,500 267,500 267,500 267,500 267,500 267,500 267,500 (106,250) 86,700) (66,326) 100.41 117.05 134.31 180.56 180.56 180.56 180.56 180.56 180.56 180.56 180.56 11.5% 12.0% 12.5% 13.0% 13.5% 14.0% 14.5% 15.0% 15.0% 15.0% 15.0% 11.55 14.05 16.79 23.47 24.38 25.28 26.18 27.08 27.0B 27.08 27.08 180.56 15.0% 27.0B 180.56 15.0% 27.0B 180.56 15.0% 27.08 180.56 15.0% 27.08 250,000 250,000 250,000 250,000 250.000 250.000 250.000 250.000 250.000 250.000 250,000 168.75 168.75 168.75 168.75 168.75 168.75 168.75 168.75 168.75 168.75 168.75 19.41 19.41 19.41 19.41 19.41 19.41 19.41 19.41 19.41 19.41 19.41 (7.86) (5.36) (2.62) 4.07 4.97 5.87 6.78 7.68 7.68 7.68 7.68 250,000 250.000 250.000 250,000 168.75 168.75 168.75 168.75 19.41 19.41 19.41 19.41 7.68 7.68 7.68 7.68 0.67 0.58 0.14 0.50 0.12 0.15 0.43 0.10 0.13 0.38 0.09 0.11 0.33 0.08 0.09 0.28 0.07 0.08 0.24 0.06 0.07 0.23 0.05 0.06 0.23 0.05 0.05 0.23 0.05 0.05 0.23 0.05 0.05 0.23 0.05 0.05 0.23 0.05 0.05 0.23 0.05 0.05 0.67 0 0.72 0 0.78 0 0.67 0 0.58 0 0.50 0 0.43 0 0.37 0 0.33 0 0.33 0 0.33 0 0.33 0 0.33 0 Old Output Old Sales Old Gross Profit Incremental Gross Profit 2. Estimate of incremental Depreciation Yr. 1 Outlays Yr. 2 Outlays Yr. 3 Outlays Total, New Depreciation 3. Overhead 4. Pretax incremental Profit 5. Tax Expense 6. Aftertax Profit 7. Cash Flow Adjustments Add Back Depreciation Less Added WIP Inventory Less Capital Spending Terminal Value, Land 8. Free Cash Flow 0.33 0 0.33 0 7.35 (8.53) (2.56) (6.08) (1.82) (4.26) 3.40 1.02 2.38 4.39 1.32 5.38 1.61 3.76 6.35 1.90 7.31 2.19 7.35 2.20 (3.39) (1.02) (2.38) 7.35 2.21 5.15 7.35 2.21 7.35 2.21 7.35 2.21 2.21 7.35 2.21 5.15 (5.97) 2.08 4.44 5.12 5.14 5.15 5.15 5.15 5.15 0.33 0.33 0.33 0.33 0.33 0.33 0.67 1.81 (5.00) 0.72 (0.42) (1.00) 0.78 (0.44) (1.00) 0.67 (1.19) 0.5B 0.03 0.50 0.03 0.43 0.03 0.37 0.03 0.33 0.12 (3.50) 40.0 (3.50) (8.49) (4.96) (3.03) 1.86 3.68 4.29 4.90 5.51 5.47 5.47 5.47 5.47 5.47 5.47 45.60 DCF, Rotterdam = 15.50 IRR, Rotterdam 18.0% 9. Adjustment for Erosion In Merseyside Volume Lost Merseyside Output Lost Merseyside Revenue Lost Merseyside Gross Profits Lost Gross Profits After Taxes Change in Merseyside Inventory Total Effect on Free Cash Flow DCF, Erosion Merseyside 3.05 Cash Flows After Erosion (3.50) TIT 17,500 11.81 1.36 0.95 0.35 17.500 11.81 1.36 0.95 0.35 17.500 11.81 1.36 0.95 0.35 17,500 11.81 1.36 0.95 0.35 17,500 11.81 1.36 0.95 0.35 17.500 11.81 1.36 0.95 0.35 17.500 11.81 1.36 0.95 0.35 17,500 11.81 1.36 0.95 0.35 17.500 11.81 1.36 0.95 0.35 (0.60) 17,500 11.81 1.36 0.95 0.35 17.500 11.81 1.36 0.95 0.35 17,500 11.81 1.36 0.95 0.35 10.60) 10.60) 10.60) (0.60) (0.60) (0.60) (0.60) 10.60) 10.60) (0.60) (0.60) (8.49) (4.96) (3.03) 1.26 3.0B 3.69 4.30 4.92 4.88 4.BB 4.88 4.BB 4.BB 4.88 45.00 DCF, Rotterdam Adjusted for Full Erosion at Merseyside= 12.45 IRR 16.5% Assumptions Annual Output (metric tons) Output Gain Per Year/Prior Year Maximum Possible Output Price/Ton (pounds sterling) Inflation (prices and costs) Gross Margin Growth Rate/Year Maximum Possible Gross Margin Gross Margin Tax Rate Investment Outlay millions) 250,000 2.0% 267,500 675 0.0% 0.50% 15.0% 11.5% 30.0% 3.5 5 1 1 Discount Rate Depreciable Life (years) Overhead/Investment Salvage Value WIP Inventory/Cost of Goods Sold Terminal Value of Right-of-Way Months Downtime, Construction 10.0% 15 0.0% 0 3.0% 40 5 4 2008 2009 2010 2011 OW Now 2008 2009 2010 0 2 3 6 13 14 5 2012 7 2014 9 2016 10 2017 11 2018 12 2019 15 2022 Now 2008 2009 2010 2011 2013 2015 2020 2021 267,500 267,500 267,500 267,500 Year 1. Estimate of incremental Gross Profit New Output tons) Lost Output-Construction New Sales Millions) New Gross Margin New Gross Pront 255,000 260,100 265,302 267,500 267,500 267,500 267,500 267,500 267,500 267,500 267,500 (106,250) 86,700) (66,326) 100.41 117.05 134.31 180.56 180.56 180.56 180.56 180.56 180.56 180.56 180.56 11.5% 12.0% 12.5% 13.0% 13.5% 14.0% 14.5% 15.0% 15.0% 15.0% 15.0% 11.55 14.05 16.79 23.47 24.38 25.28 26.18 27.08 27.0B 27.08 27.08 180.56 15.0% 27.0B 180.56 15.0% 27.0B 180.56 15.0% 27.08 180.56 15.0% 27.08 250,000 250,000 250,000 250,000 250.000 250.000 250.000 250.000 250.000 250.000 250,000 168.75 168.75 168.75 168.75 168.75 168.75 168.75 168.75 168.75 168.75 168.75 19.41 19.41 19.41 19.41 19.41 19.41 19.41 19.41 19.41 19.41 19.41 (7.86) (5.36) (2.62) 4.07 4.97 5.87 6.78 7.68 7.68 7.68 7.68 250,000 250.000 250.000 250,000 168.75 168.75 168.75 168.75 19.41 19.41 19.41 19.41 7.68 7.68 7.68 7.68 0.67 0.58 0.14 0.50 0.12 0.15 0.43 0.10 0.13 0.38 0.09 0.11 0.33 0.08 0.09 0.28 0.07 0.08 0.24 0.06 0.07 0.23 0.05 0.06 0.23 0.05 0.05 0.23 0.05 0.05 0.23 0.05 0.05 0.23 0.05 0.05 0.23 0.05 0.05 0.23 0.05 0.05 0.67 0 0.72 0 0.78 0 0.67 0 0.58 0 0.50 0 0.43 0 0.37 0 0.33 0 0.33 0 0.33 0 0.33 0 0.33 0 Old Output Old Sales Old Gross Profit Incremental Gross Profit 2. Estimate of incremental Depreciation Yr. 1 Outlays Yr. 2 Outlays Yr. 3 Outlays Total, New Depreciation 3. Overhead 4. Pretax incremental Profit 5. Tax Expense 6. Aftertax Profit 7. Cash Flow Adjustments Add Back Depreciation Less Added WIP Inventory Less Capital Spending Terminal Value, Land 8. Free Cash Flow 0.33 0 0.33 0 7.35 (8.53) (2.56) (6.08) (1.82) (4.26) 3.40 1.02 2.38 4.39 1.32 5.38 1.61 3.76 6.35 1.90 7.31 2.19 7.35 2.20 (3.39) (1.02) (2.38) 7.35 2.21 5.15 7.35 2.21 7.35 2.21 7.35 2.21 2.21 7.35 2.21 5.15 (5.97) 2.08 4.44 5.12 5.14 5.15 5.15 5.15 5.15 0.33 0.33 0.33 0.33 0.33 0.33 0.67 1.81 (5.00) 0.72 (0.42) (1.00) 0.78 (0.44) (1.00) 0.67 (1.19) 0.5B 0.03 0.50 0.03 0.43 0.03 0.37 0.03 0.33 0.12 (3.50) 40.0 (3.50) (8.49) (4.96) (3.03) 1.86 3.68 4.29 4.90 5.51 5.47 5.47 5.47 5.47 5.47 5.47 45.60 DCF, Rotterdam = 15.50 IRR, Rotterdam 18.0% 9. Adjustment for Erosion In Merseyside Volume Lost Merseyside Output Lost Merseyside Revenue Lost Merseyside Gross Profits Lost Gross Profits After Taxes Change in Merseyside Inventory Total Effect on Free Cash Flow DCF, Erosion Merseyside 3.05 Cash Flows After Erosion (3.50) TIT 17,500 11.81 1.36 0.95 0.35 17.500 11.81 1.36 0.95 0.35 17.500 11.81 1.36 0.95 0.35 17,500 11.81 1.36 0.95 0.35 17,500 11.81 1.36 0.95 0.35 17.500 11.81 1.36 0.95 0.35 17.500 11.81 1.36 0.95 0.35 17,500 11.81 1.36 0.95 0.35 17.500 11.81 1.36 0.95 0.35 (0.60) 17,500 11.81 1.36 0.95 0.35 17.500 11.81 1.36 0.95 0.35 17,500 11.81 1.36 0.95 0.35 10.60) 10.60) 10.60) (0.60) (0.60) (0.60) (0.60) 10.60) 10.60) (0.60) (0.60) (8.49) (4.96) (3.03) 1.26 3.0B 3.69 4.30 4.92 4.88 4.BB 4.88 4.BB 4.BB 4.88 45.00 DCF, Rotterdam Adjusted for Full Erosion at Merseyside= 12.45 IRR 16.5%
Step by Step Solution
There are 3 Steps involved in it

Get step-by-step solutions from verified subject matter experts