

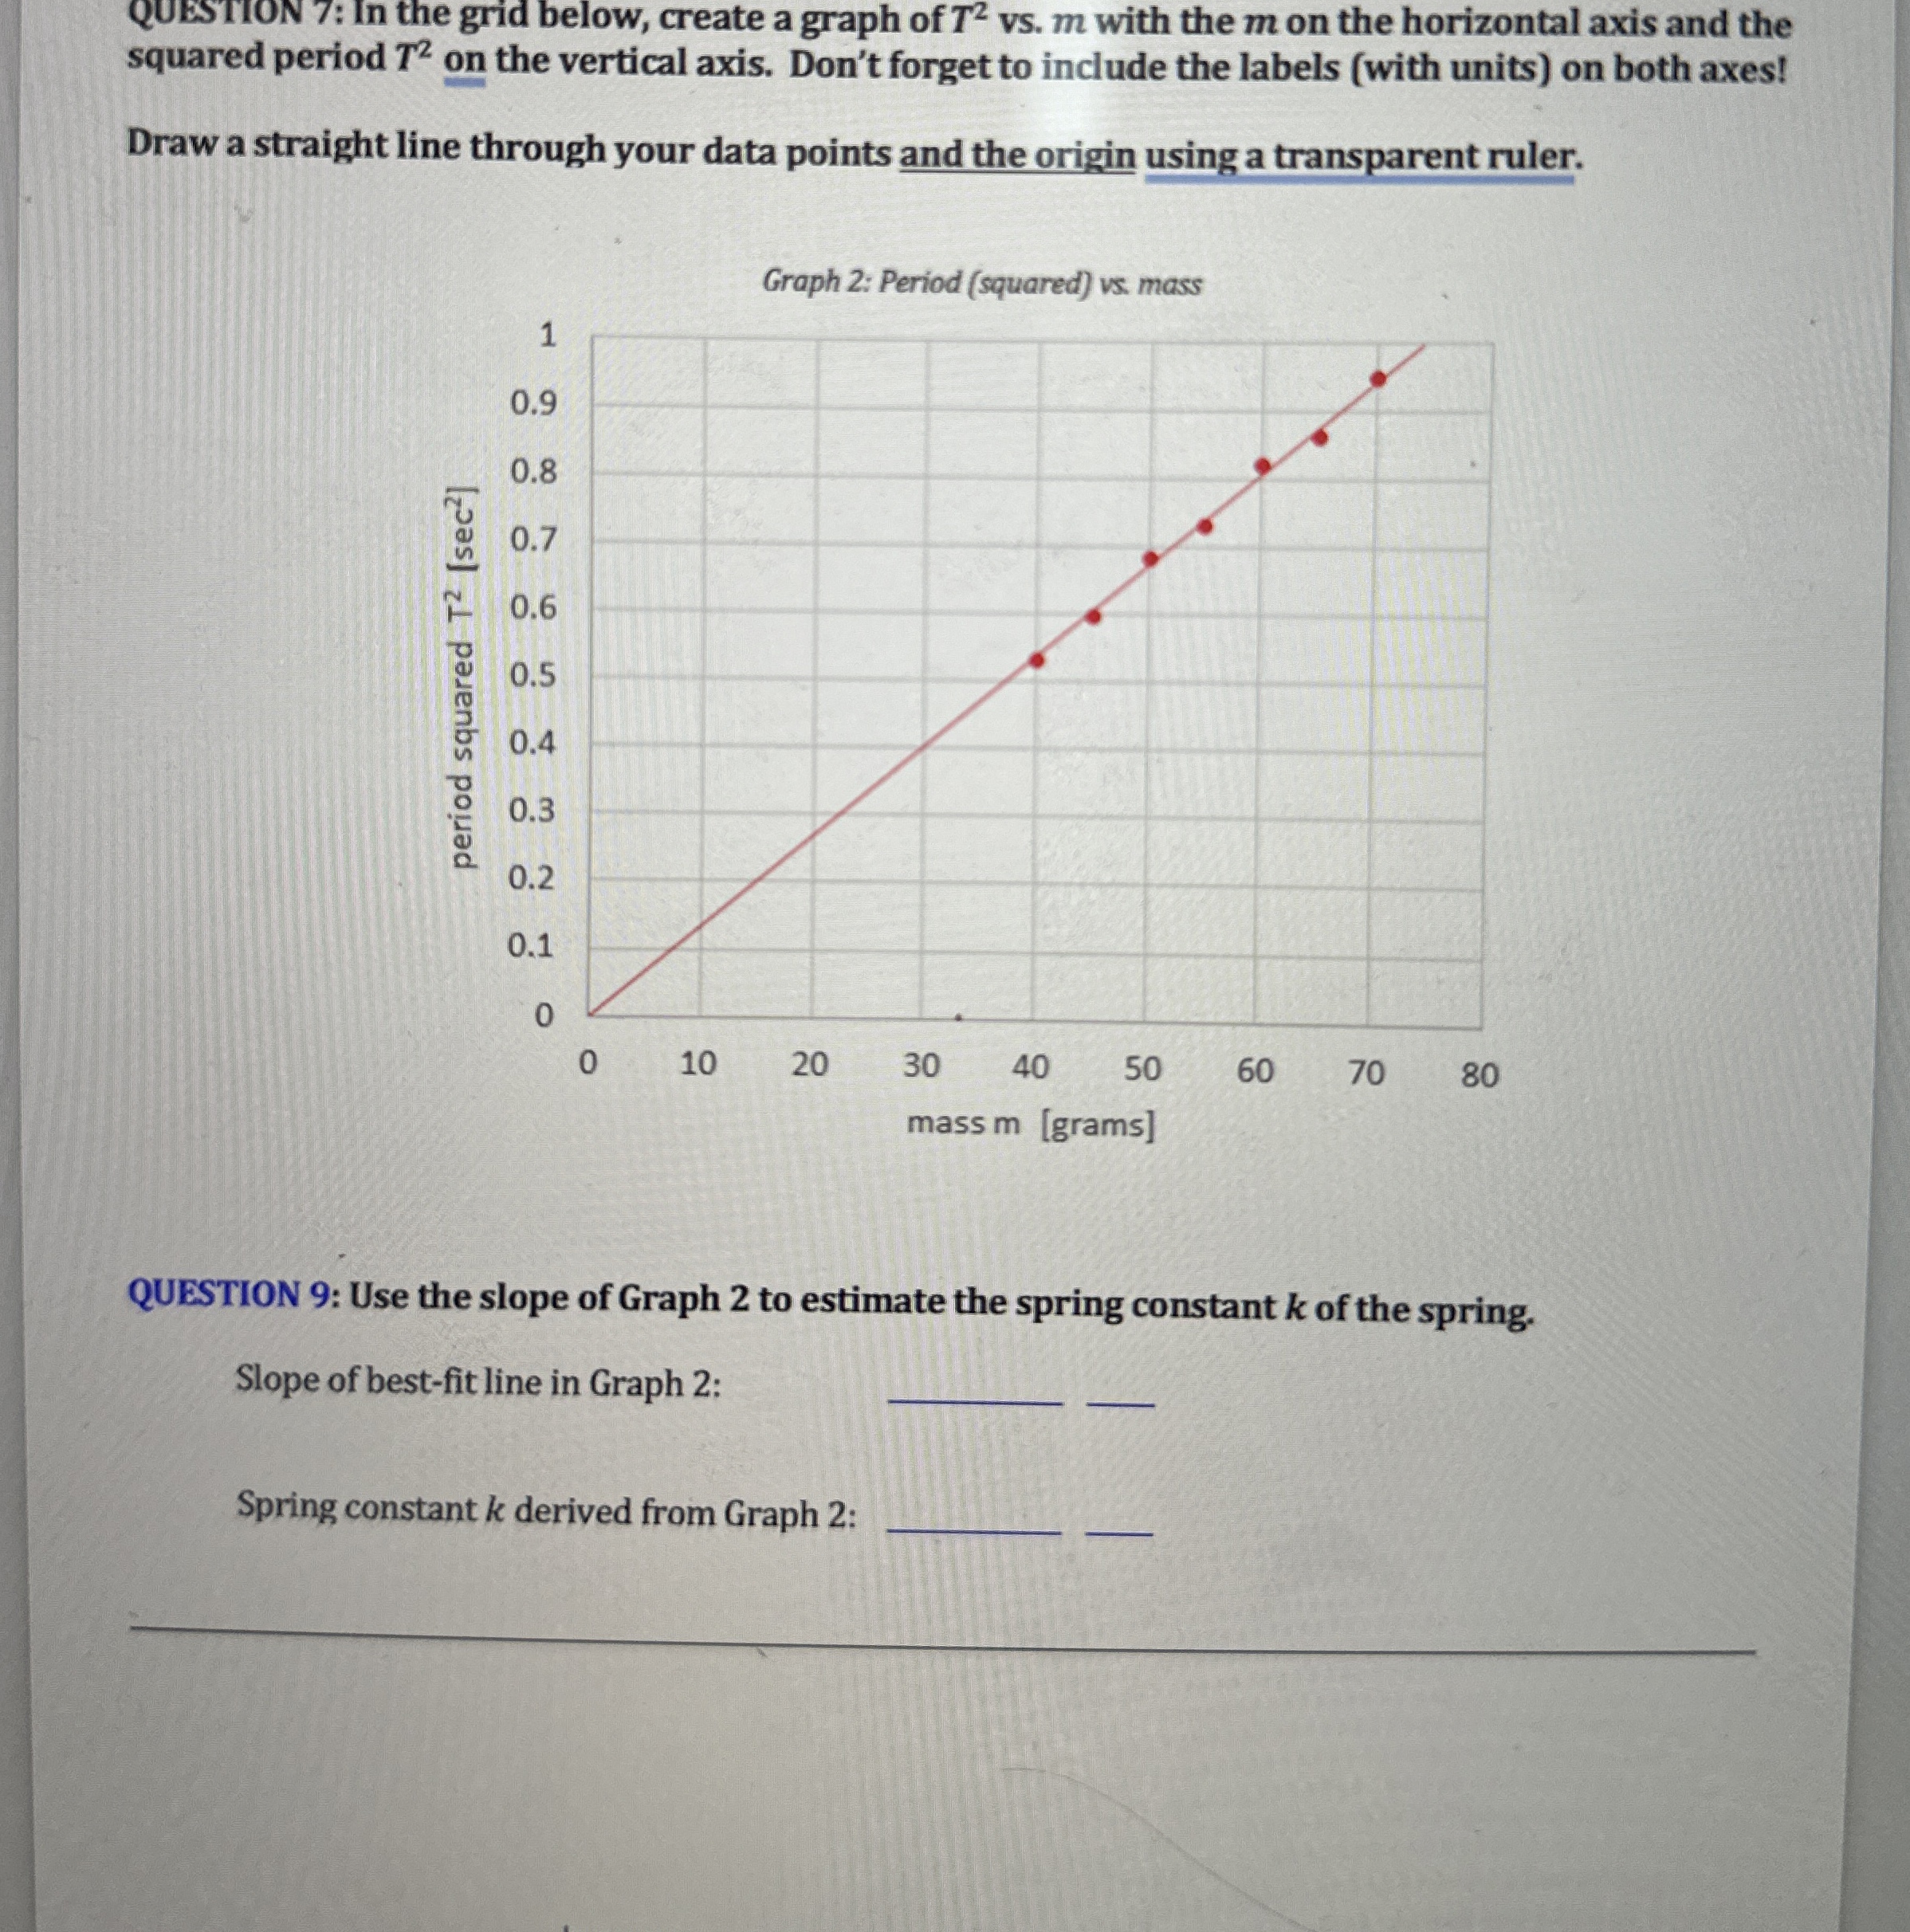
Question: QUESTION 7 : In the grid below, create a graph of T 2 vs . m with the m on the horizontal axis and the
QUESTION : In the grid below, create a graph of vs with the on the horizontal axis and the squared period on the vertical axis. Don't forget to include the labels with units on both axes!
Draw a straight line through your data points and the origin using a transparent ruler.
Graph : Period squared us mass
QUESTION : Use the slope of Graph to estimate the spring constant of the spring.
Slope of bestfit line in Graph :
Spring constant derived from Graph :
Step by Step Solution
There are 3 Steps involved in it
1 Expert Approved Answer
Step: 1 Unlock

Question Has Been Solved by an Expert!
Get step-by-step solutions from verified subject matter experts
Step: 2 Unlock
Step: 3 Unlock