

Question: Question 7 In this question, you are asked to plot some histograms and kernel density estimates. We will use the mpg dataset that is available
Question
In this question, you are asked to plot some histograms and kernel density estimates. We will use the mpg dataset that is
available in the ggplot library you likely saw this dataset in DAT already Run the following cell to load the
ggplot library and preview the first few rows of :
In : libraryggplot
head mpg
A tibble:
Part a
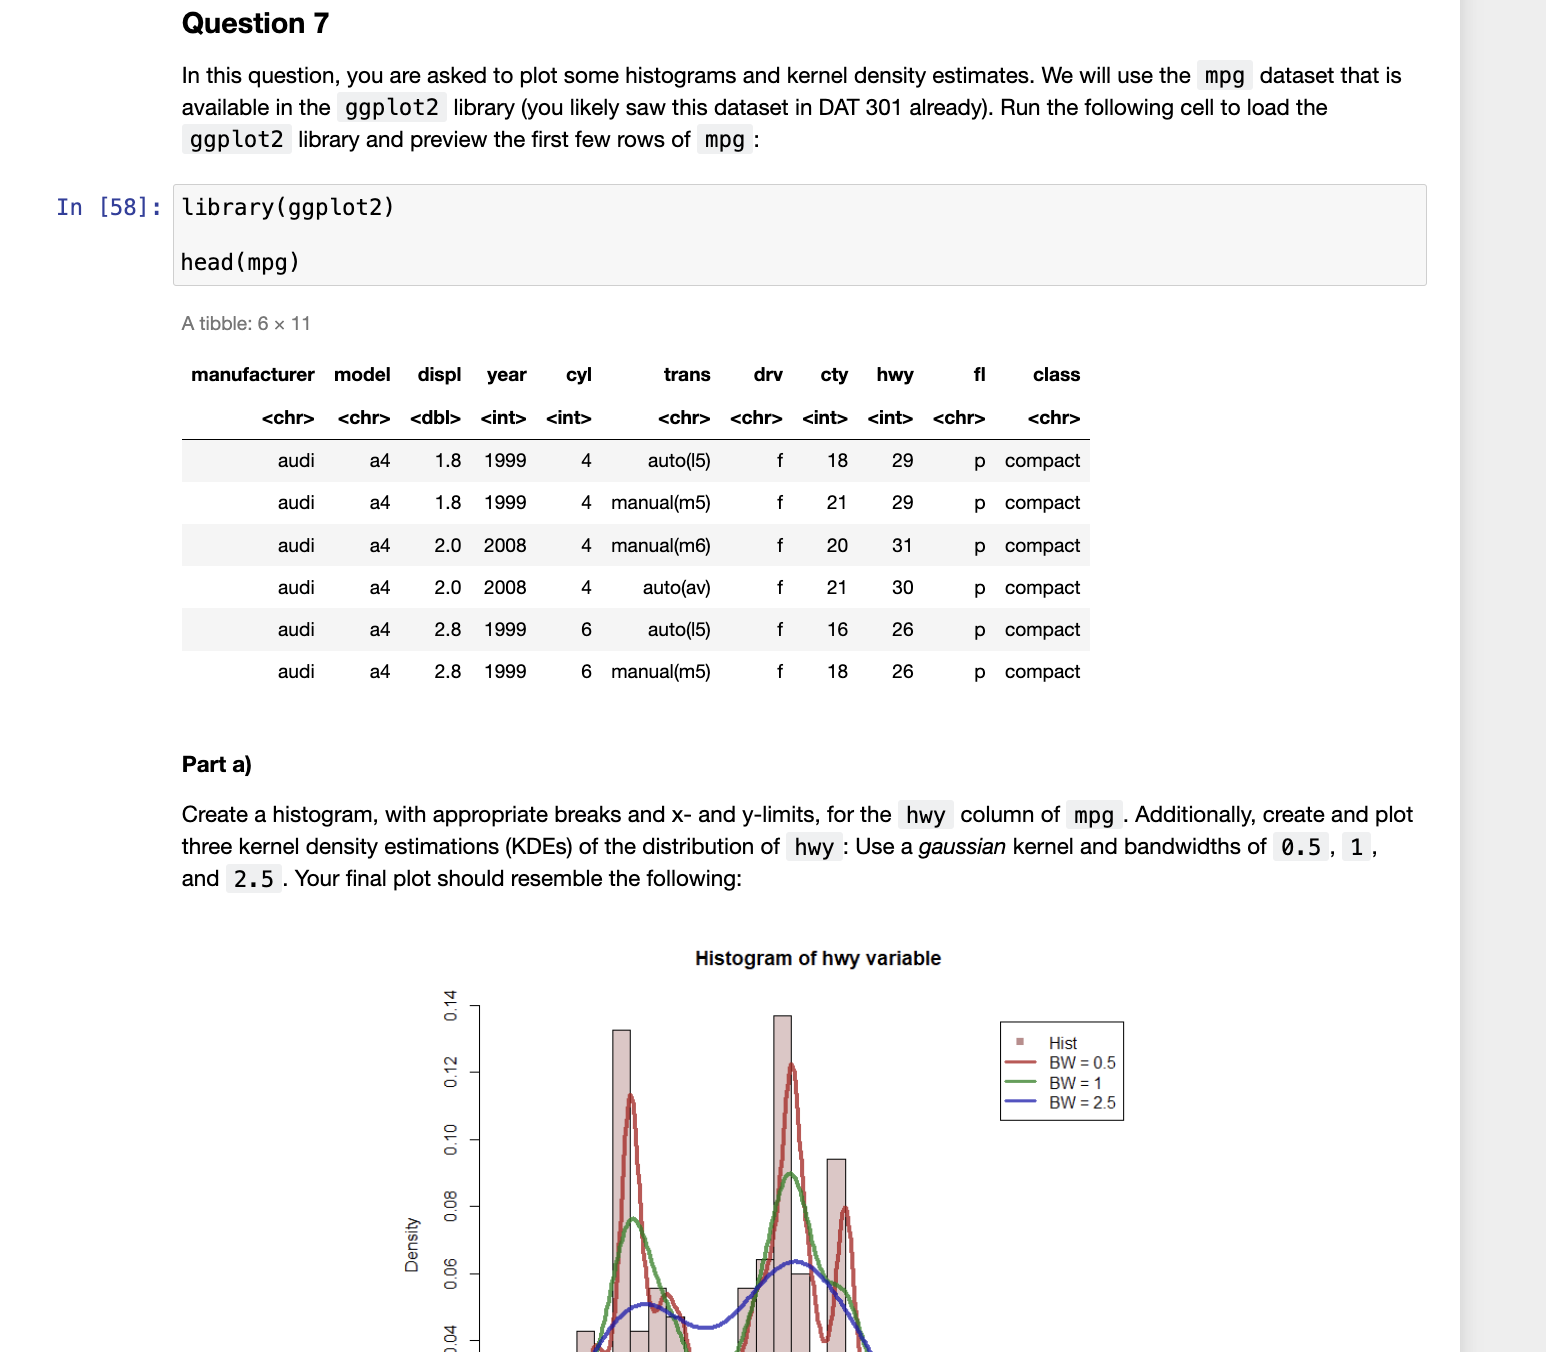
Create a histogram, with appropriate breaks and and limits for the hwy column of Additionally, create and plot
three kernel density estimations KDEs of the distribution of hwy : Use a gaussian kernel and bandwidths of
and Your final plot should resemble the following:
Histoaram of hwv variable
Hist
Step by Step Solution
There are 3 Steps involved in it
1 Expert Approved Answer
Step: 1 Unlock

Question Has Been Solved by an Expert!
Get step-by-step solutions from verified subject matter experts
Step: 2 Unlock
Step: 3 Unlock