

Question: Question 7 - Interactive Assignm X Course Hero X + V X ezto.mheducation.com/ext/map/index.html?_con=con&external_browser=0&launchUrl=https%253A%252F%252Fnewconnect.mheducation.com%252F#/activity/q... @ @ * . .. Interactive Assignment: Regression Saved Help Save &
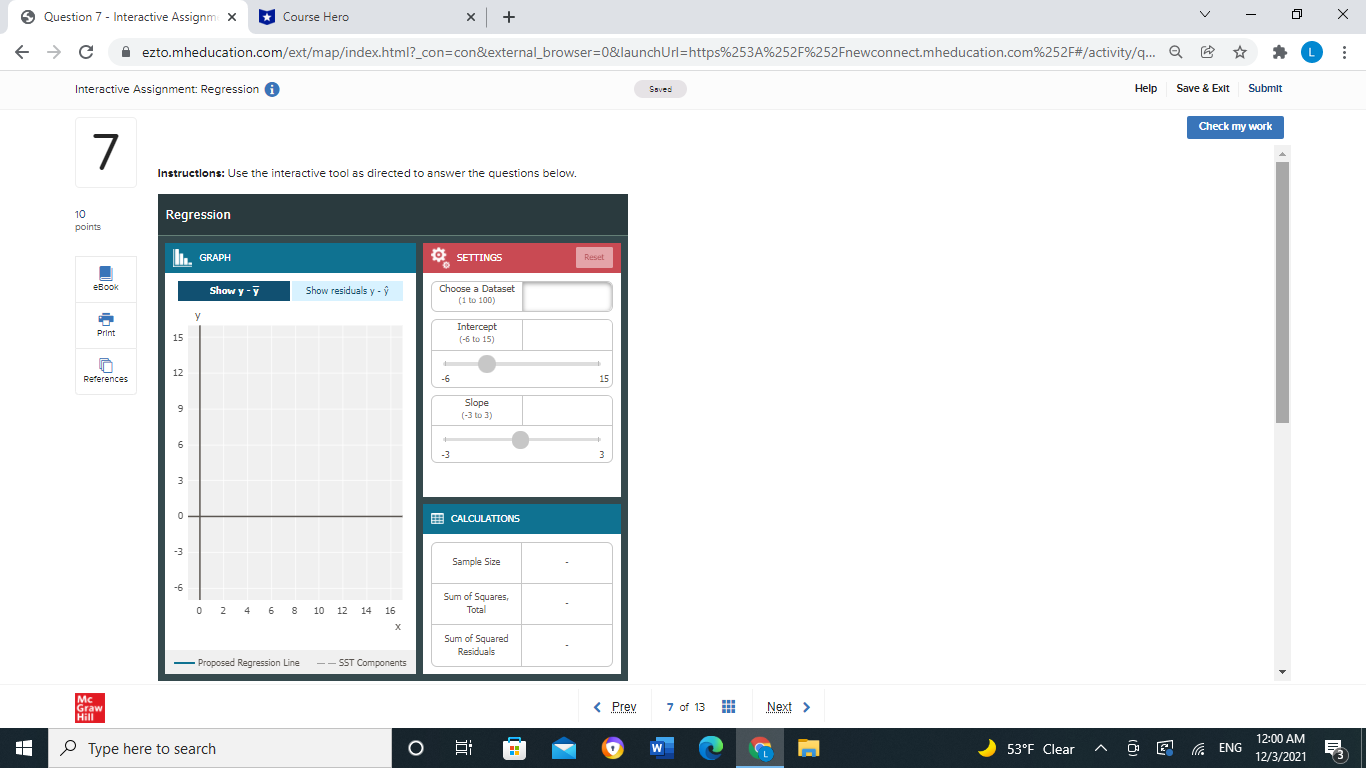
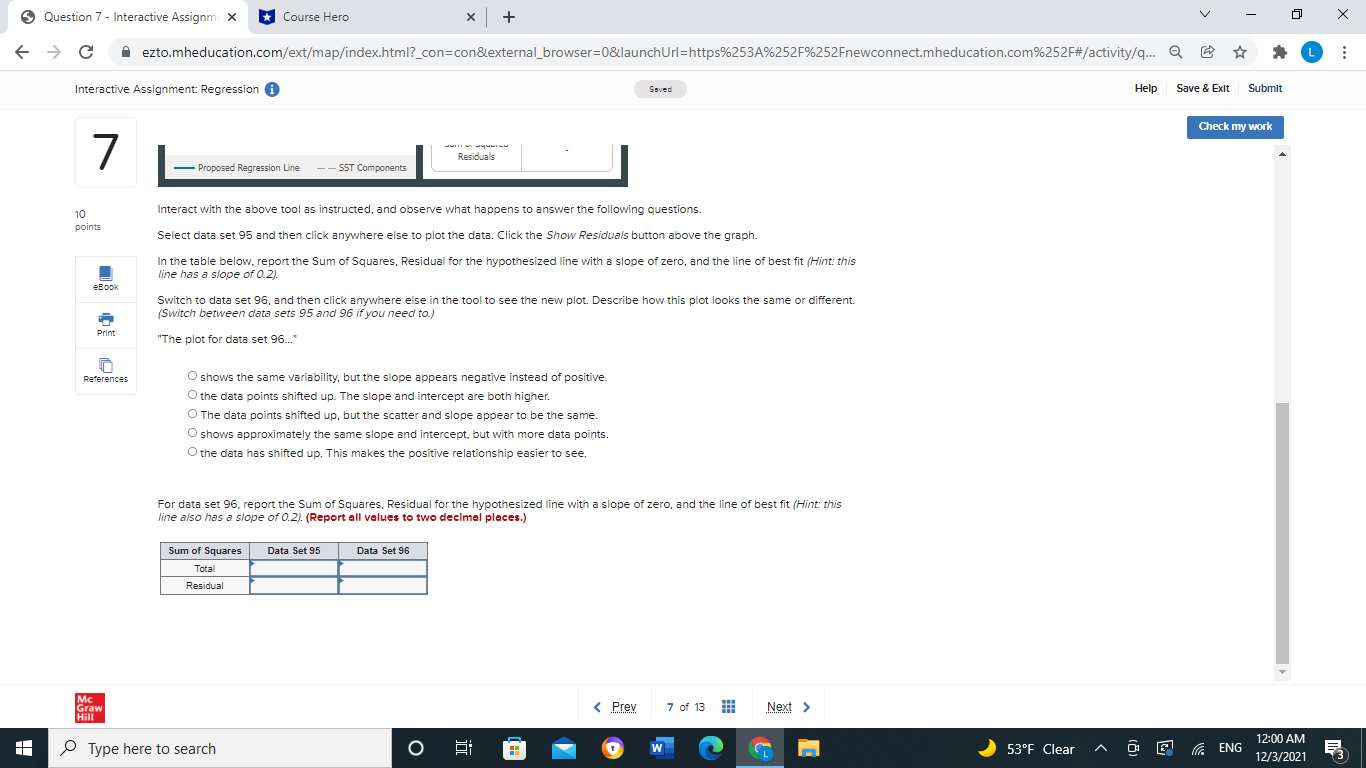
Question 7 - Interactive Assignm X Course Hero X + V X ezto.mheducation.com/ext/map/index.html?_con=con&external_browser=0&launchUrl=https%253A%252F%252Fnewconnect.mheducation.com%252F#/activity/q... @ @ * . .. Interactive Assignment: Regression Saved Help Save & Exit Submit Check my work Instructions: Use the interactive tool as directed to answer the questions below. 10 Regression points II. GRAPH SETTINGS Reset =Book Show y - y Show residuals y - y Choose a Dataset (1 to 100) Print Intercept (-6 to 15) 12 References -6 15 9 Slope (-3 to 3) 6 -3 3 CALCULATIONS -3 Sample Size Sum of Squares, 2 4 6 8 10 12 14 16 Total Sum of Squared Residuals Proposed Regression Line - - SST Components Mc Graw Type here to search O O W 12:00 AM 53'F Clear ~ 9 ENG 12/3/2021 53Question 7 - Interactive Assignm X Course Hero X + V X ezto.mheducation.com/ext/map/index.html?_con=con&external_browser=0&launchUrl=https%253A%252F%252Fnewconnect.mheducation.com%252F#/activity/q... @ @ * . .. Interactive Assignment: Regression Saved Help Save & Exit Submit Check my work 7 Residuals - Proposed Regression Line - 5ST Components 10 Interact with the above tool as instructed, and observe what happens to answer the following questions. points Select data set 95 and then click anywhere else to plot the data. Click the Show Residuals button above the graph. In the table below. report the Sum of Squares, Residual for the hypothesized line with a slope of zero, and the line of best fit (Hint: this line has a slope of 0.2). Book Switch to data set 96, and then click anywhere else in the tool to see the new plot. Describe how this plot looks the same or different. (Switch between data sets 95 and 96 if you need to.) Print "The plot for data set 96..." References O shows the same variability, but the slope appears negative instead of positive. O the data points shifted up. The slope and intercept are both higher. O The data points shifted up, but the scatter and slope appear to be the same. shows approximately the same slope and intercept, but with more data points. O the data has shifted up. This makes the positive relationship easier to see. For data set 96, report the Sum of Squares, Residual for the hypothesized line with a slope of zero, and the line of best fit (Hint: this line also has a slope of 0.2). (Report all values to two decimal places.) Sum of Squares Data Set 95 Data Set 96 Tota Residual Mc Graw 12:00 AM Type here to search O O W 53'F Clear ~ O ENG 12/3/2021 53
Step by Step Solution
There are 3 Steps involved in it

Get step-by-step solutions from verified subject matter experts