

Question: Question 7 Next O Question 7 The percentages of police officers who are women are listed in the table for various city populations. City Population
Question 7 Next
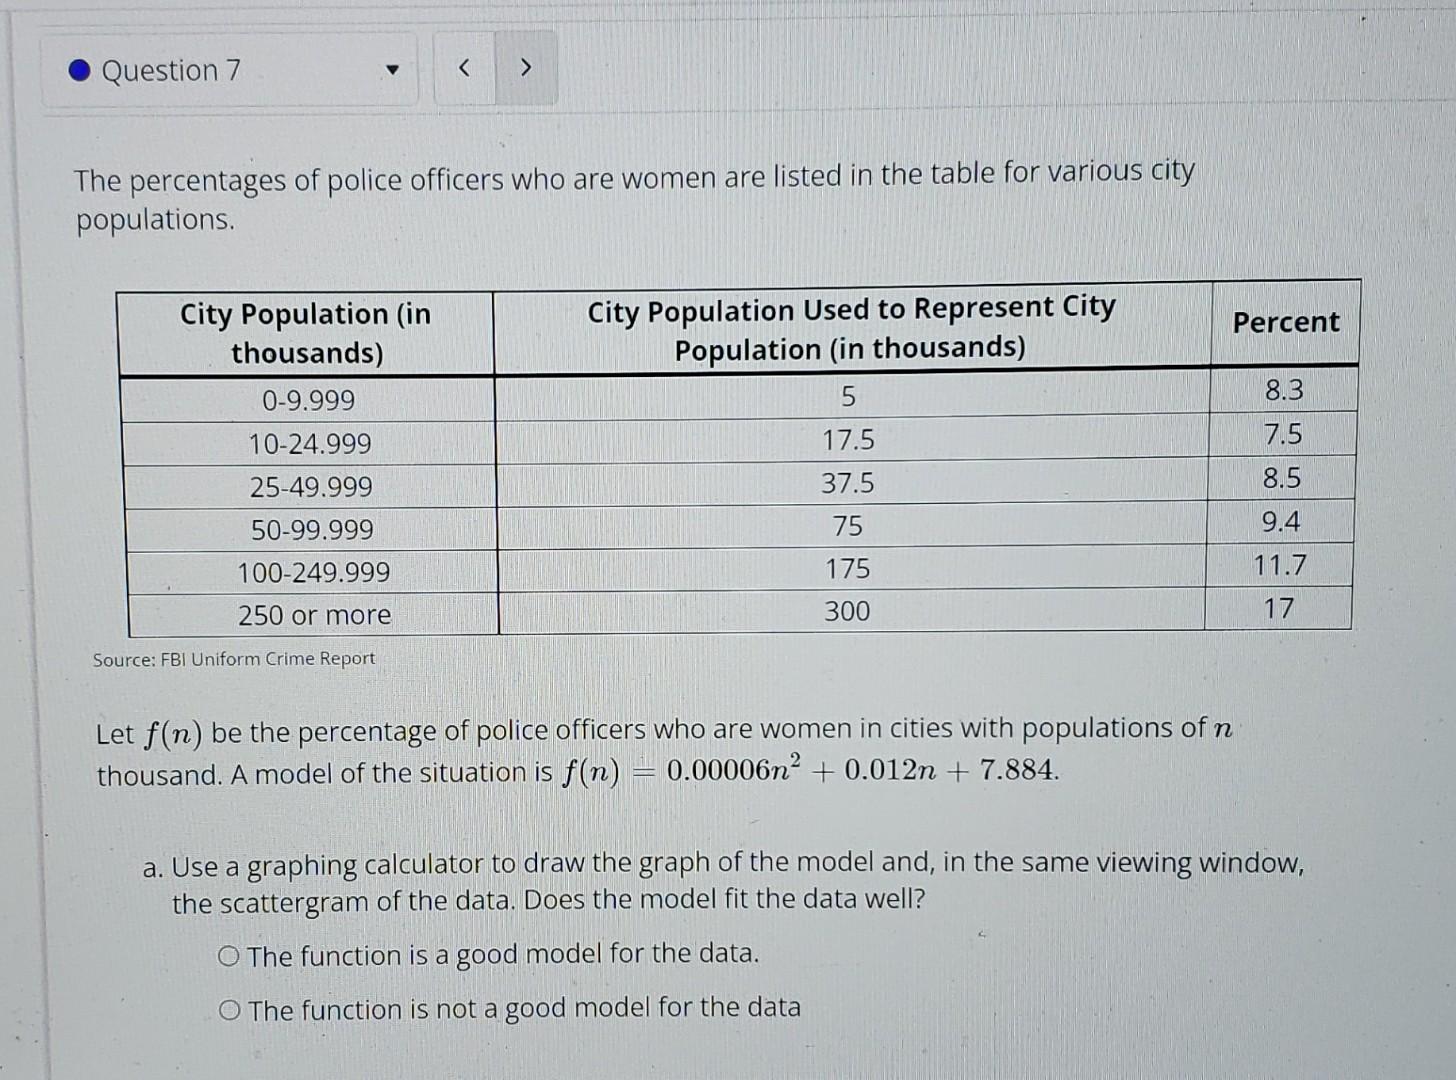
O Question 7 The percentages of police officers who are women are listed in the table for various city populations. City Population (in thousands) 0_9.999 10-24.999 25-49.999 50-99.999 100-249.999 250 or more Source: FBI Uniform Crime Report City Population Used to Represent City Population (in thousands) 17.5 37.5 75 175 300 Percent 8.3 7.5 8.5 9.4 11.7 Let f(n) be the percentage of police officers who are women in cities with populations of n thousand. A model of the situation is f(n) 0.00006n2 + 0.012n + 7.884. a. Use a graphing calculator tdraw the graph of the model and, in the same viewing window, the scattergram of the data. Does the model fit the data well? O The function is a good model for the data. O The function is not a good model for the data
Step by Step Solution
There are 3 Steps involved in it

Get step-by-step solutions from verified subject matter experts