

Question: Question 7 please Q7 please!! Q7 please!! data 7. Select values from Knowledge LLC's financial reports and market prices are provided in the accompanying excel.
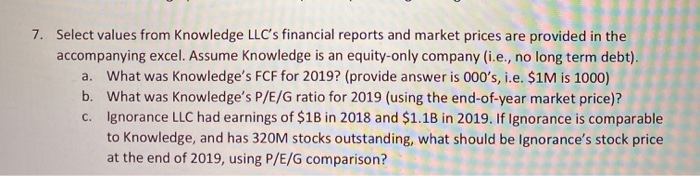
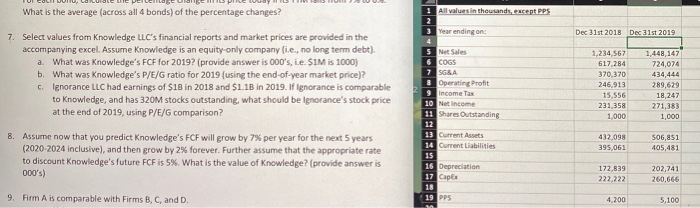
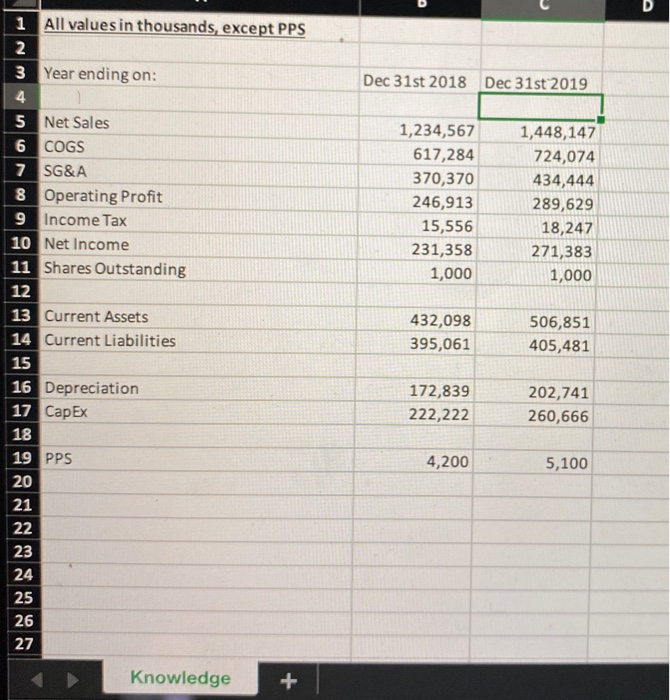
7. Select values from Knowledge LLC's financial reports and market prices are provided in the accompanying excel. Assume Knowledge is an equity-only company (ie., no long term debt). a. What was knowledge's FCF for 2019? (provide answer is 000's, i.e. $1M is 1000) b. What was knowledge's P/E/G ratio for 2019 (using the end-of-year market price)? c. Ignorance LLC had earnings of $1B in 2018 and $1.1B in 2019. If Ignorance is comparable to Knowledge, and has 320M stocks outstanding, what should be ignorance's stock price at the end of 2019, using P/E/G comparison? What is the average (across all 4 bonds) of the percentage changes? 1 All values in thousands, except PPS Dec 31st 2018 Dec 31st 2019 7. Select values from Knowledge LLC's financial reports and market prices are provided in the accompanying excel. Assume Knowledge is an equity-only company i.e., no long term debt). a. What was knowledge's FCF for 2019? (provide answer is 000's, Le SIM is 1000) b. What was knowledge's P/E/G ratio for 2019 (using the end-of-year market price)? C. Ignorance LLC had earnings of $1B in 2018 and $1.1B in 2019. If Ignorance is comparable to Knowledge, and has 320M stocks outstanding, what should be ignorance's stock price at the end of 2019, using P/E/G comparison? s Net Sales 6 COGS 7 SGEA 3 Operating Profit 1,234,567 617 284 370.370 246,913 15,556 231,358 1,000 1,448,147 724,074 434.444 289,629 con 18,247 10 Net Income 11 Share Outstanding 271,383 1,000 13 Current Assets 14 Current Liabilities 432.098 395,061 506,851 405,481 8. Assume now that you predict Knowledge's FCF will grow by 7% per year for the next 5 years (2020-2024 inclusive), and then grow by 2% forever. Further assume that the appropriate rate to discount Knowledge's future FCF is 5%. What is the value of Knowledge? (provide answer is 000's) 16 Depreciation 17 Caps 172.839 222 222 202,741 260,666 9. Firm A is comparable with Firms B, C, and D. 29 p 4.2005 ,100 1 All values in thousands, except PPS 3 Year ending on: Dec 31st 2018 Dec 31st 2019 1,234,567 617,284 370,370 246,913 15,556 231,358 1,000 1,448,147 724,074 434,444 289,629 18,247 271,383 1,000 5 Net Sales 6 COGS 7 SG&A 8 Operating Profit 9 Income Tax 10 Net Income 11 Shares Outstanding 12 13 Current Assets 14 Current Liabilities 15 16 Depreciation 17 CapEx 18 19 PPS 20 21 432,098 395,061 506,851 405,481 172,839 222,222 202,741 260,666 4,200 5,100 23 24 25 26 27 Knowledge
Step by Step Solution
There are 3 Steps involved in it

Get step-by-step solutions from verified subject matter experts