

Question: QUESTION 7 : Solve in Matlab. Write a local function called cosLineWidths that will plot c o s ( x ) for x values ranging
QUESTION :
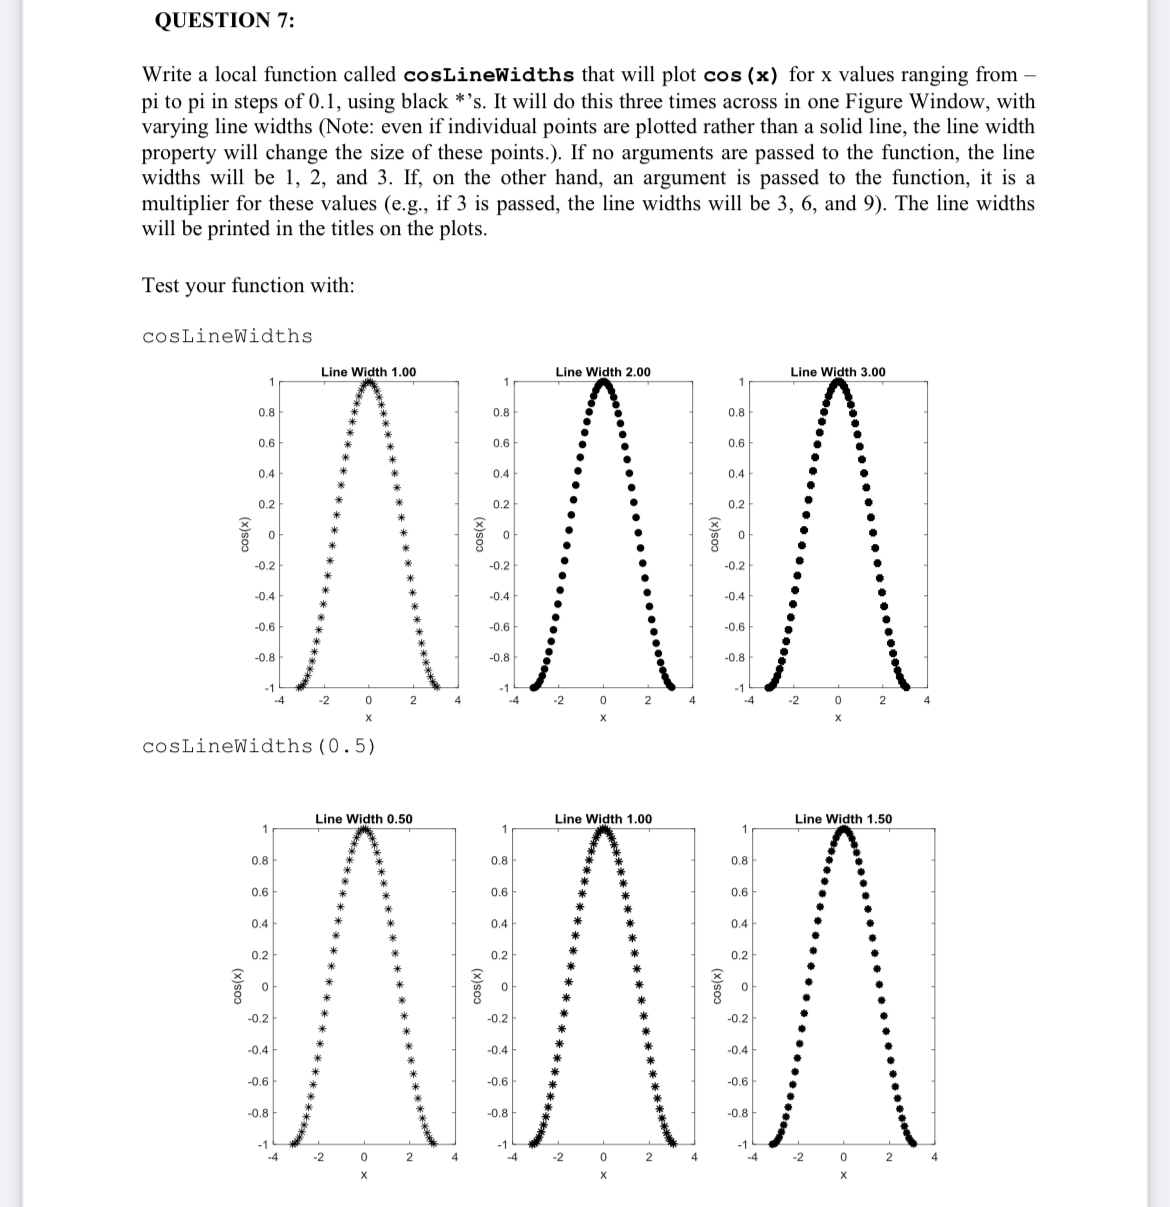
Solve in Matlab. Write a local function called cosLineWidths that will plot for values ranging from pi to pi in steps of using black s It will do this three times across in one Figure Window, with varying line widths Note: even if individual points are plotted rather than a solid line, the line width property will change the size of these points. If no arguments are passed to the function, the line widths will be and If on the other hand, an argument is passed to the function, it is a multiplier for these values eg if is passed, the line widths will be and The line widths will be printed in the titles on the plots.
Test your function with:
cosLineWidths
cosLineWidths
Step by Step Solution
There are 3 Steps involved in it
1 Expert Approved Answer
Step: 1 Unlock

Question Has Been Solved by an Expert!
Get step-by-step solutions from verified subject matter experts
Step: 2 Unlock
Step: 3 Unlock