

Question: Question 7 (TCO 3) When creating a chart in Excel, a single data series compares values for one set of data compares two or
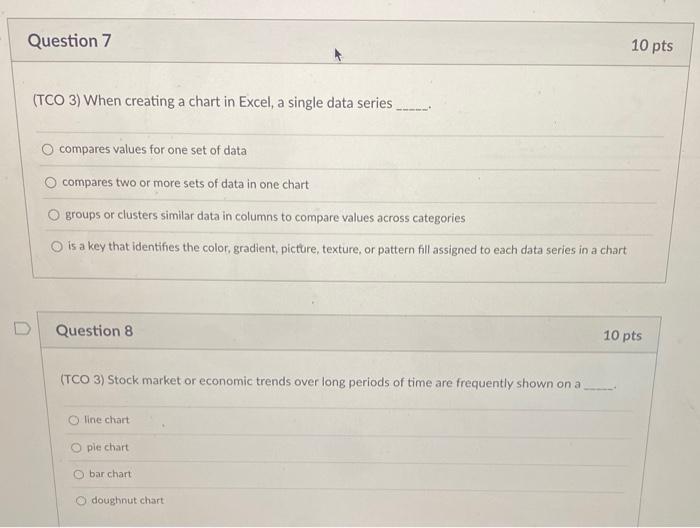
Question 7 (TCO 3) When creating a chart in Excel, a single data series compares values for one set of data compares two or more sets of data in one chart groups or clusters similar data in columns to compare values across categories O is a key that identifies the color, gradient, picture, texture, or pattern fill assigned to each data series in a chart D Question 8 (TCO 3) Stock market or economic trends over long periods of time are frequently shown on a Oline chart pie chart. Obar chart O doughnut chart 10 pts 10 pts
Step by Step Solution
There are 3 Steps involved in it
1 Expert Approved Answer
Step: 1 Unlock

Question Has Been Solved by an Expert!
Get step-by-step solutions from verified subject matter experts
Step: 2 Unlock
Step: 3 Unlock