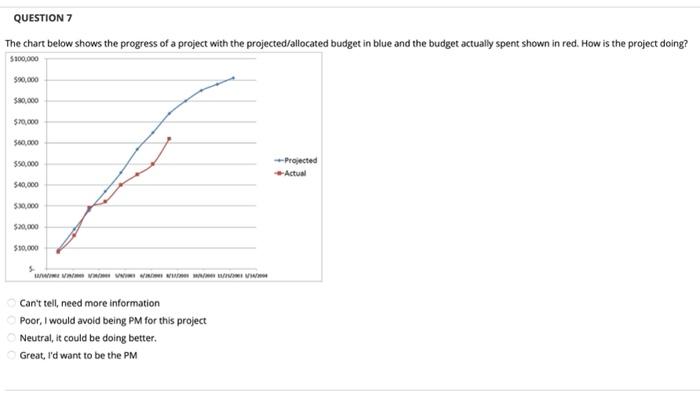
Question: QUESTION 7 The chart below shows the progress of a project with the projected/allocated budget in blue and the budget actually spent shown in red.

QUESTION 7 The chart below shows the progress of
QUESTION 7 The chart below shows the progress of a project with the projected/allocated budget in blue and the budget actually spent shown in red. How is the project doing? 5100.000 50.000 $80,000 $70,000 $60.000 550.000 Projected --Actual $20.000 $10,000 5 Can't tell need more information Poor, I would avoid being PM for this project Neutral, it could be doing better. Great, I'd want to be the PM QUESTIONS In the figure below, what does the difference in the two lines that Box A is pointing to indicate? Today Budgeted (Planned) Spending son-Hours) Cost (Person-Ho B Eamed Value Actual Spending Time (Date) Project is over budget Can't tell need more information Project is behind schedule Project is on budget Project is ahead of schedule Project is under budget Project is on schedule

Step by Step Solution

There are 3 Steps involved in it

1 Expert Approved Answer
Step: 1 Unlock blur-text-image
Question Has Been Solved by an Expert!

Get step-by-step solutions from verified subject matter experts

Step: 2 Unlock
Step: 3 Unlock

Students Have Also Explored These Related General Management Questions!