

Question: Question 7 The graph below is a total cost graph. The capacity per period is 200. TC is in AED. TC 1000 900 800 700
Question 7 The graph below is a total cost graph. The capacity per period is 200. TC is in AED. TC 1000 900 800 700 600 500 (0, 450) 400 300 200 100 0 0 50 Find the Unit Variable Cost. AED Find the Fixed Cost. AED Write the Total Cost Equation. 100 150 What are the total costs when 130 units of the product are sold? AED (200, 900) 200
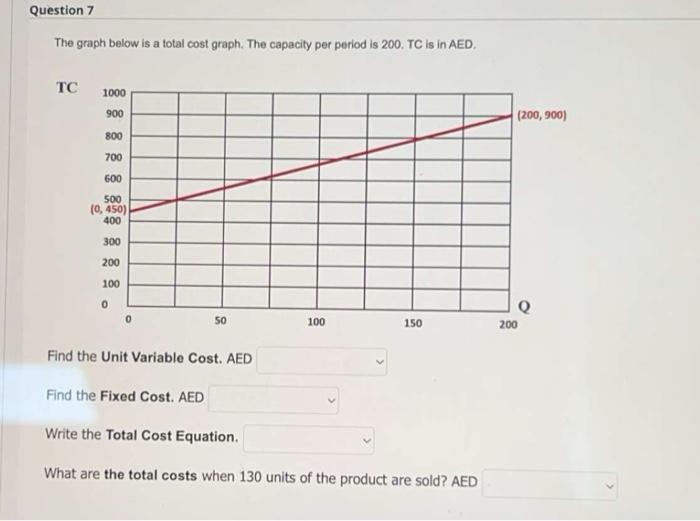
The graph below is a total cost graph. The capacity per period is 200. TC is in AED
Step by Step Solution
There are 3 Steps involved in it
1 Expert Approved Answer
Step: 1 Unlock

Question Has Been Solved by an Expert!
Get step-by-step solutions from verified subject matter experts
Step: 2 Unlock
Step: 3 Unlock