

Question: Question 7 What is shown on this table? HISTORICAL YIELDS OR RETURNS (Vary with Risk) CD or BANK DEPOSITS 10 8 Corporate bonds 5o CD
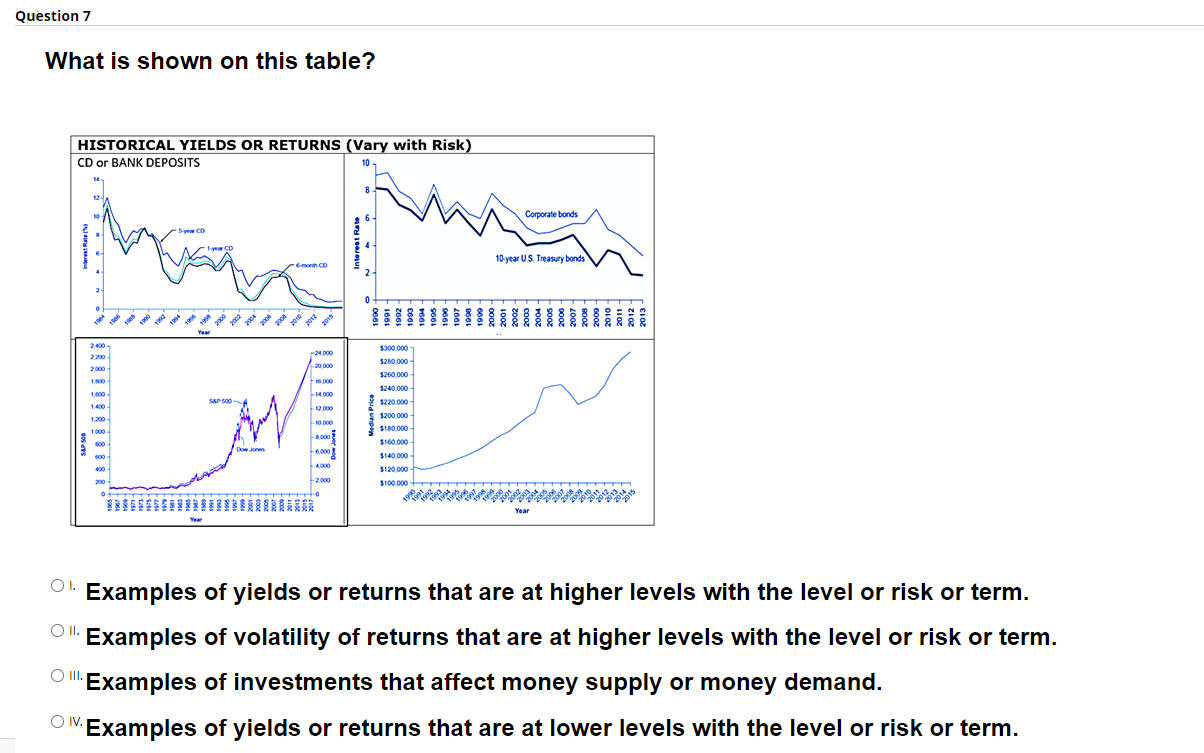
Question 7 What is shown on this table? HISTORICAL YIELDS OR RETURNS (Vary with Risk) CD or BANK DEPOSITS 10 8 Corporate bonds 5o CD ima 1 year CD 10-year US Treasury bonds - CD 0 . 2010 12 2.400 2200 -24.000 20 000 1.00 16.000 $300.000 5200.000 $260.000 5240.000 $220.000 $200.000 $180.000 1000 14000 SAP 500 1.400 12.000 1.200 M 10000 1.000 300 600 6.000 4000 $160.000 $140.000 $120.000 $100.000 200 -2.000 0 Year OI. O II. Examples of yields or returns that are at higher levels with the level or risk or term. Examples of volatility of returns that are at higher levels with the level or risk or term. Examples of investments that affect money supply or money demand. ON Examples of yields or returns that are at lower levels with the level or risk or term. O III. Question 7 What is shown on this table? HISTORICAL YIELDS OR RETURNS (Vary with Risk) CD or BANK DEPOSITS 10 8 Corporate bonds 5o CD ima 1 year CD 10-year US Treasury bonds - CD 0 . 2010 12 2.400 2200 -24.000 20 000 1.00 16.000 $300.000 5200.000 $260.000 5240.000 $220.000 $200.000 $180.000 1000 14000 SAP 500 1.400 12.000 1.200 M 10000 1.000 300 600 6.000 4000 $160.000 $140.000 $120.000 $100.000 200 -2.000 0 Year OI. O II. Examples of yields or returns that are at higher levels with the level or risk or term. Examples of volatility of returns that are at higher levels with the level or risk or term. Examples of investments that affect money supply or money demand. ON Examples of yields or returns that are at lower levels with the level or risk or term. O
Step by Step Solution
There are 3 Steps involved in it

Get step-by-step solutions from verified subject matter experts