Question: Question 71 pts What is the expected return for a portfolio that has $800 invested in Stock A and $1,200 invested in Stock B, if
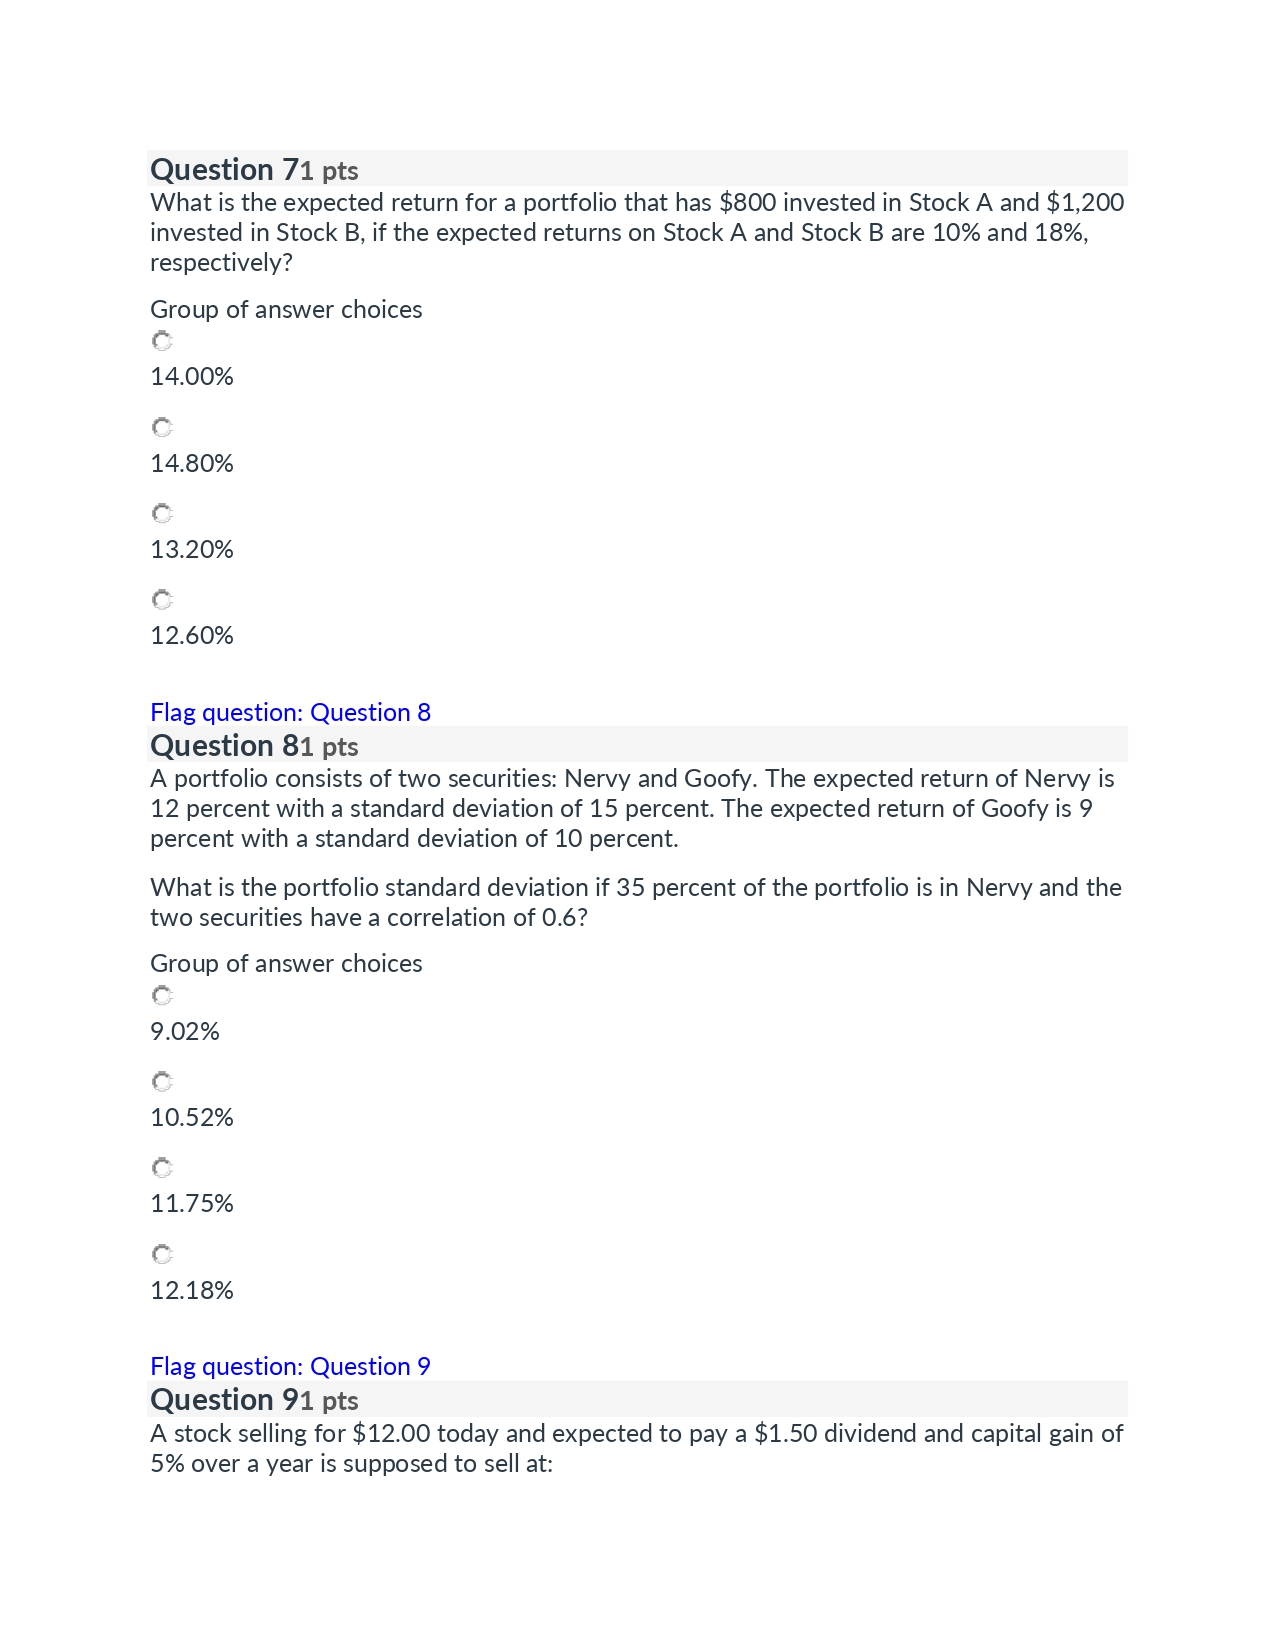
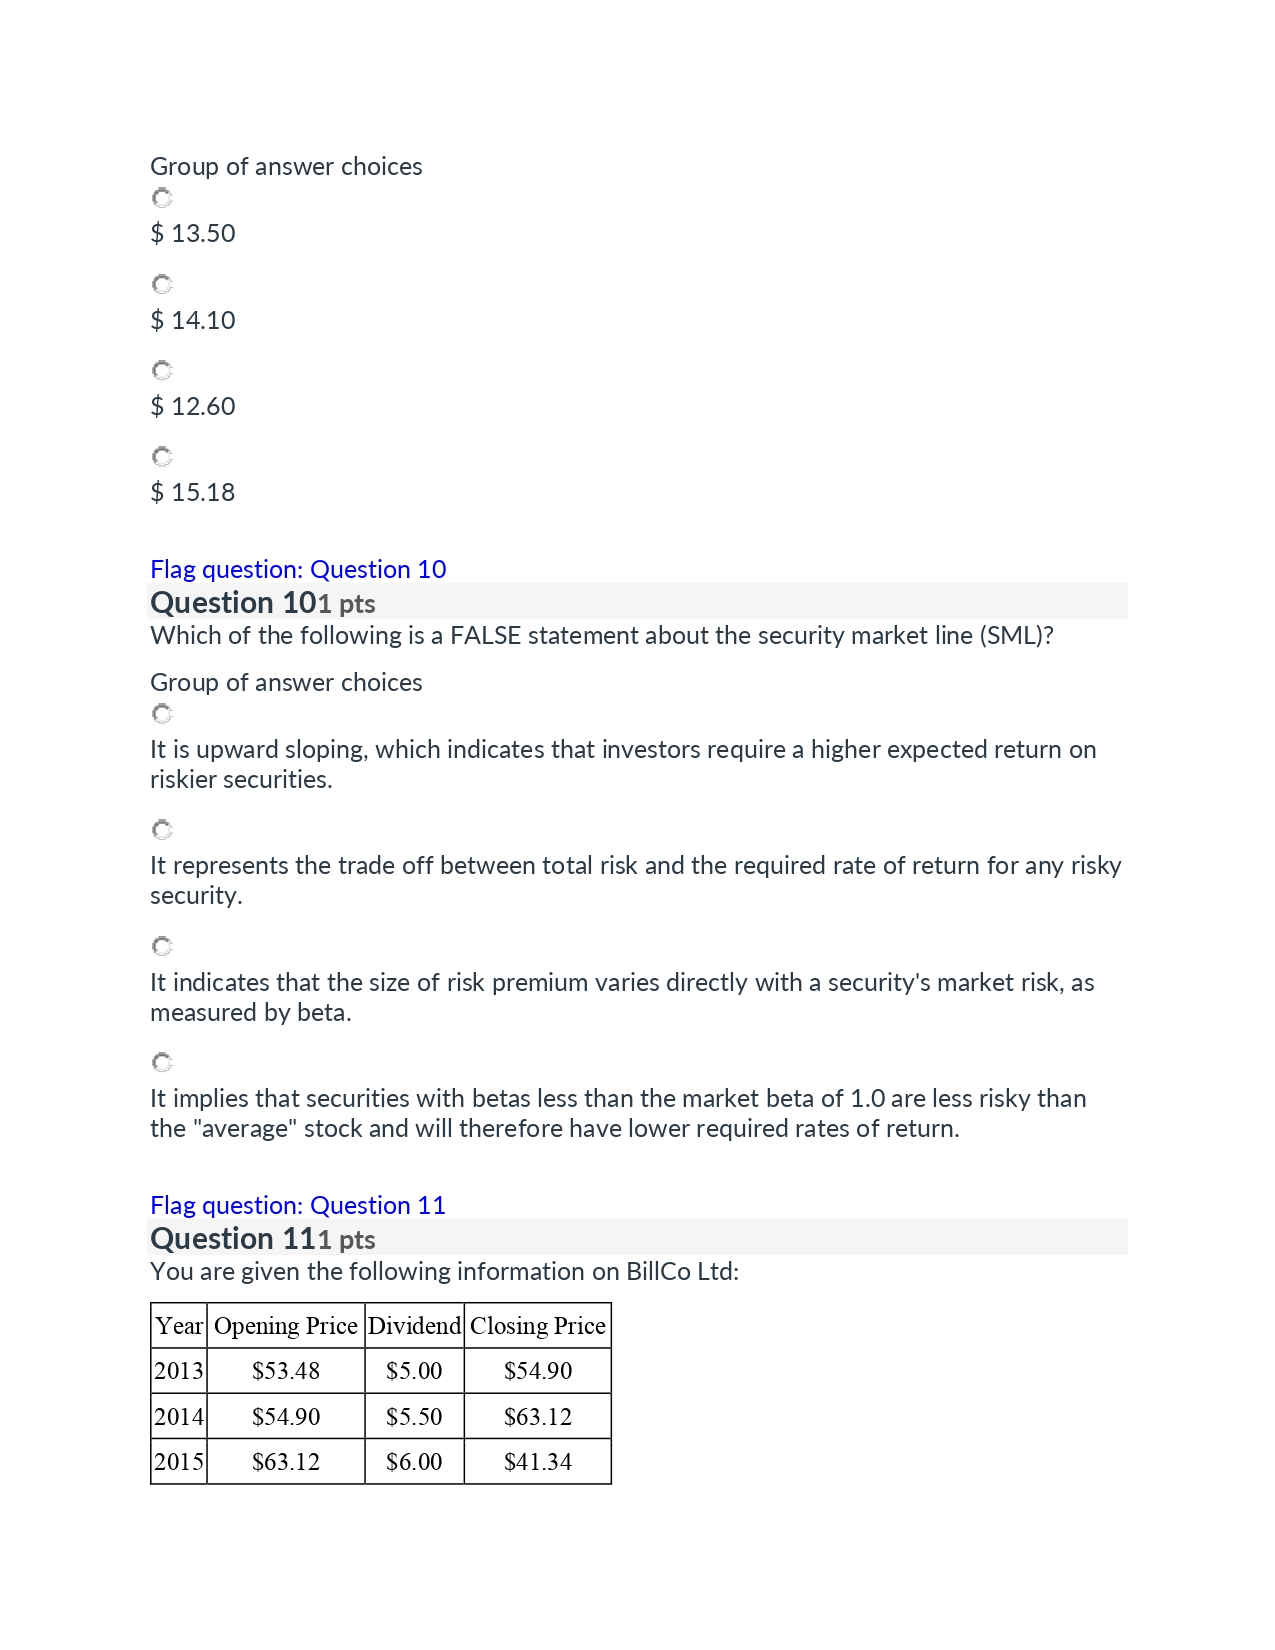
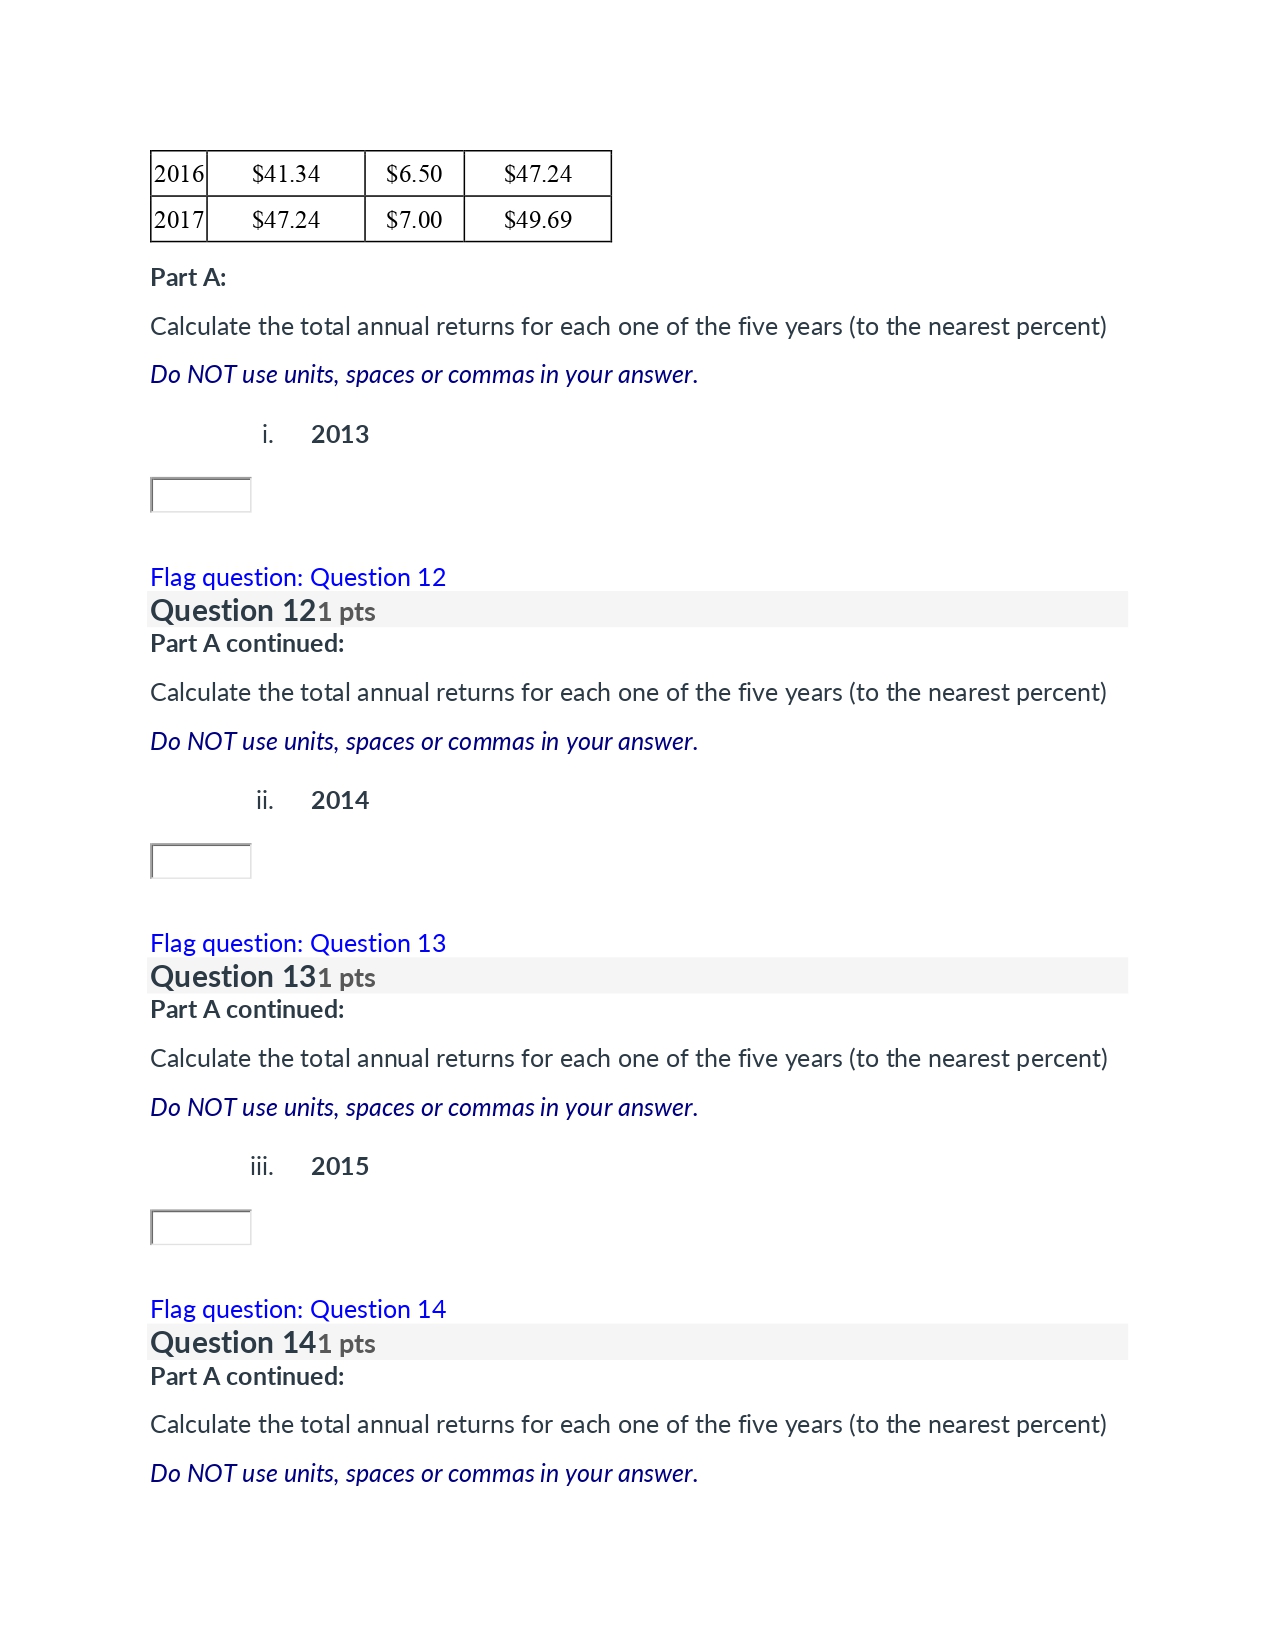
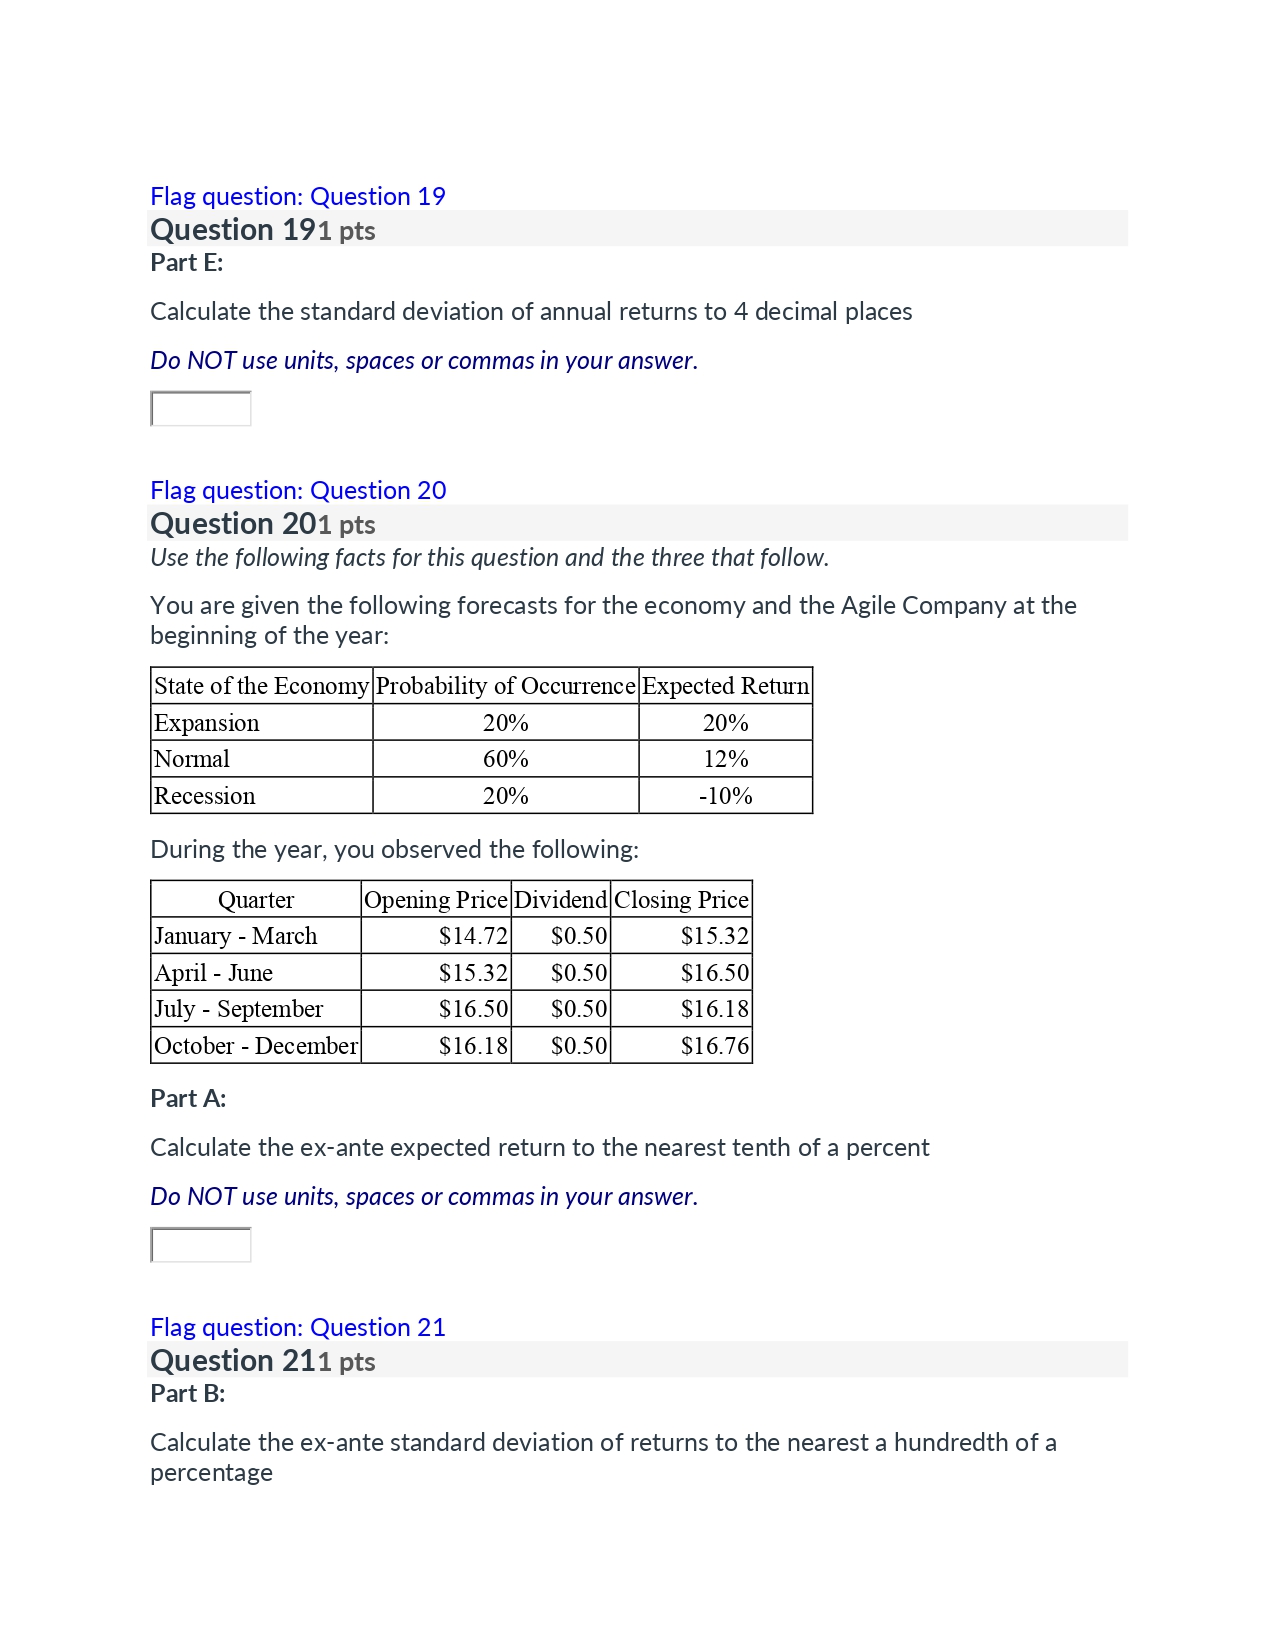
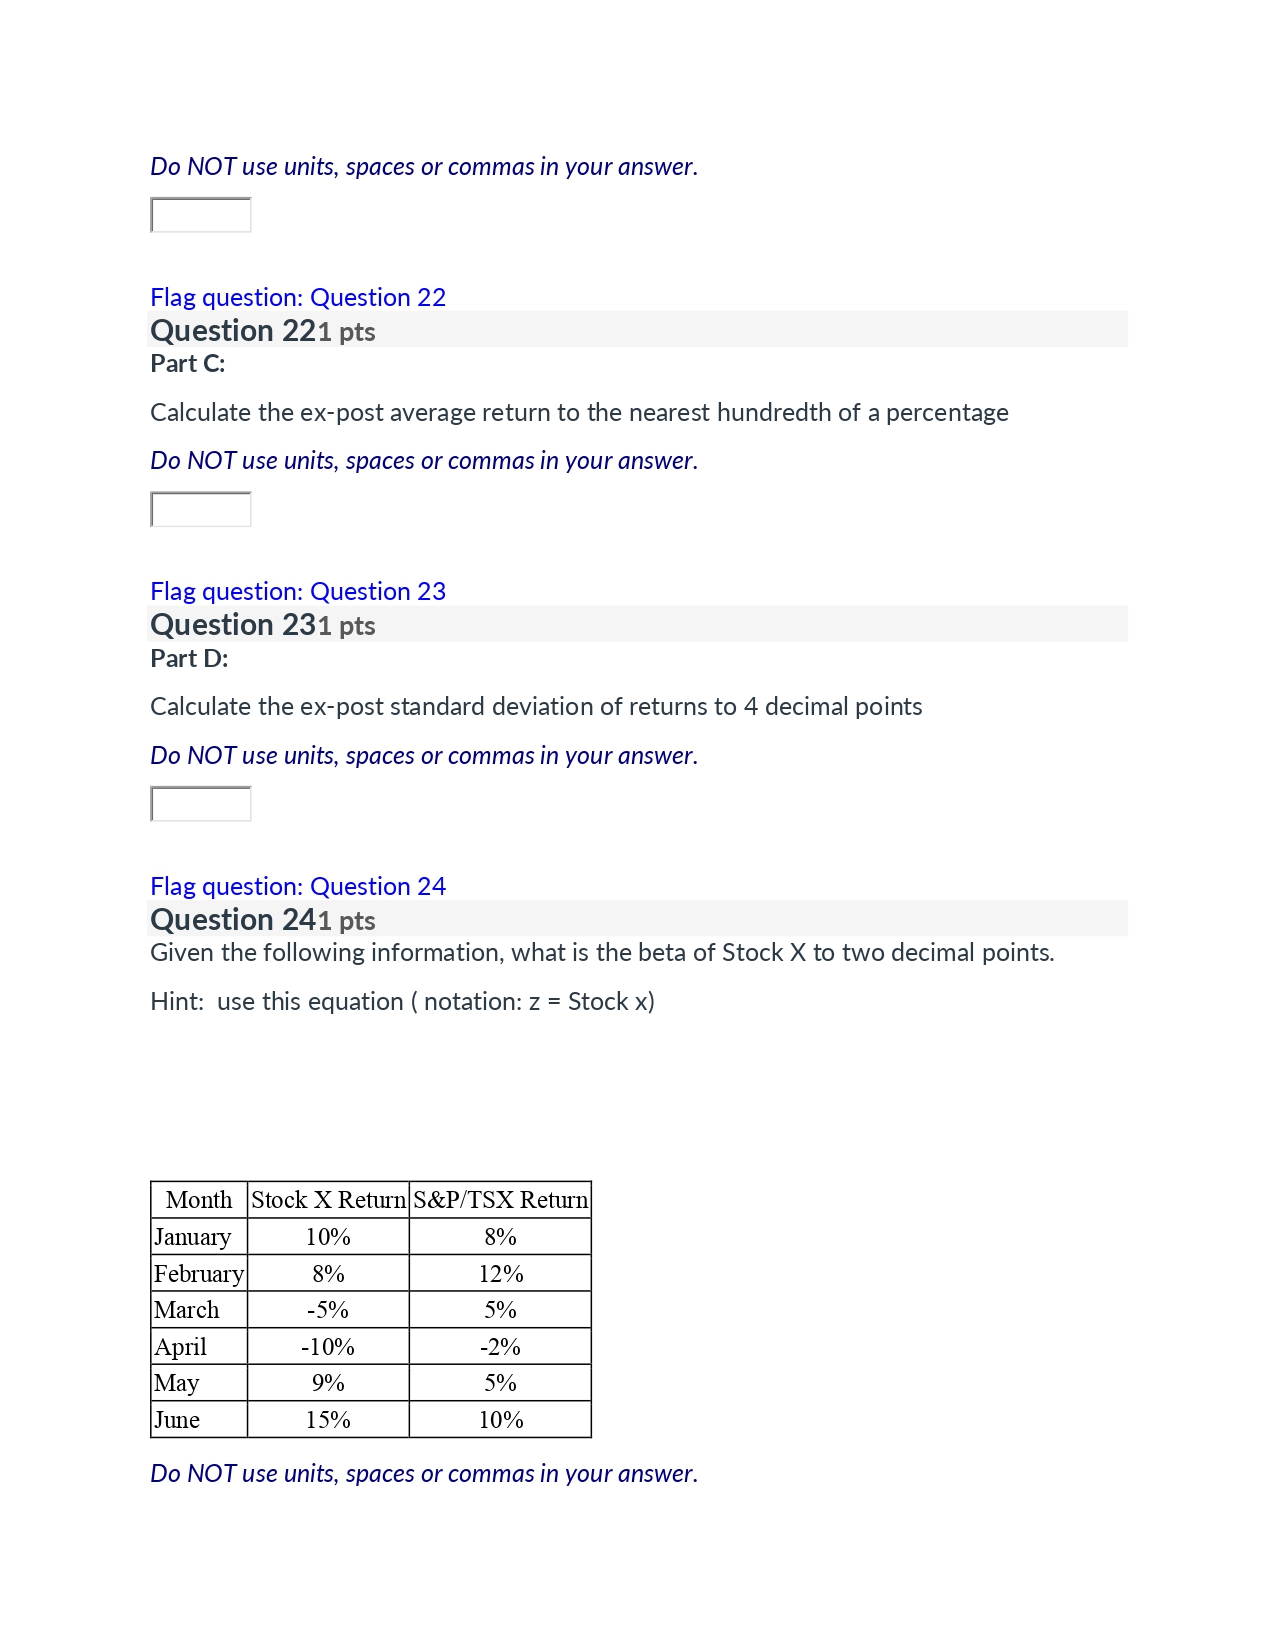
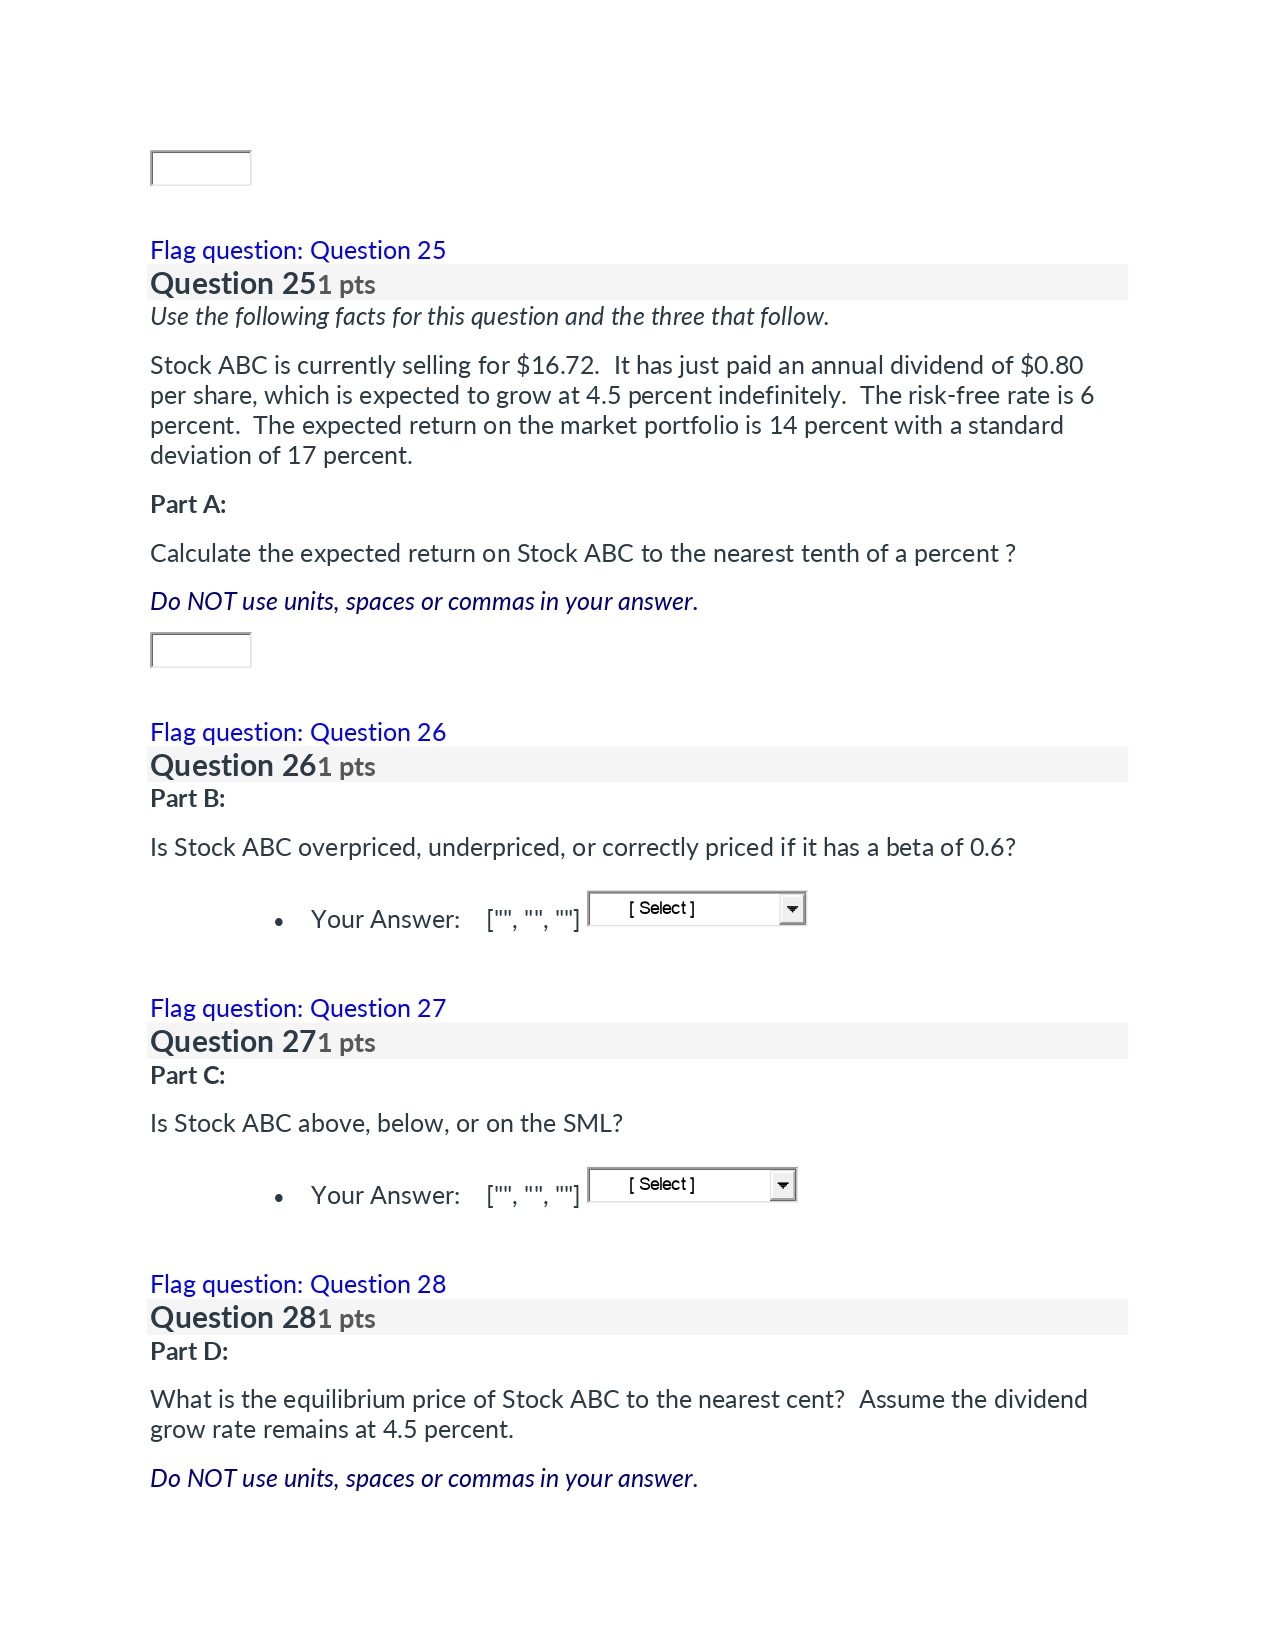
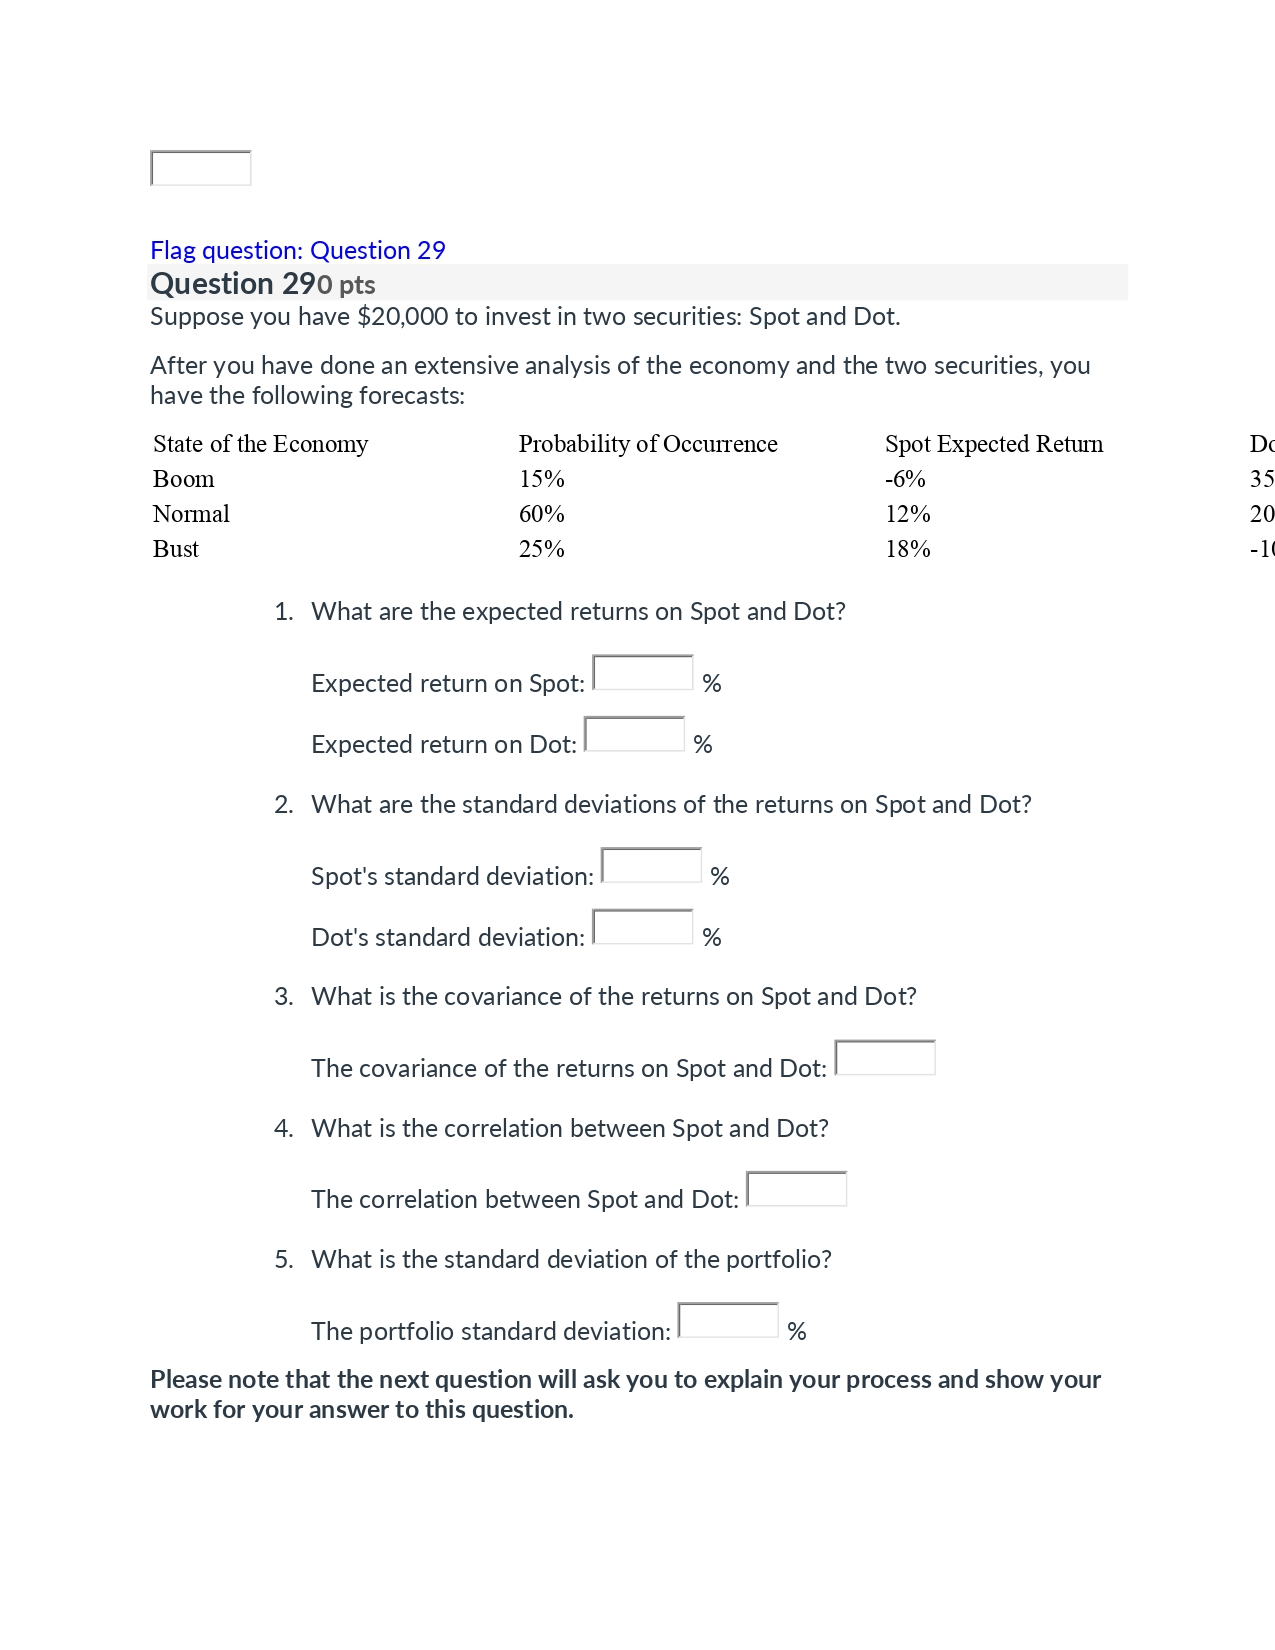
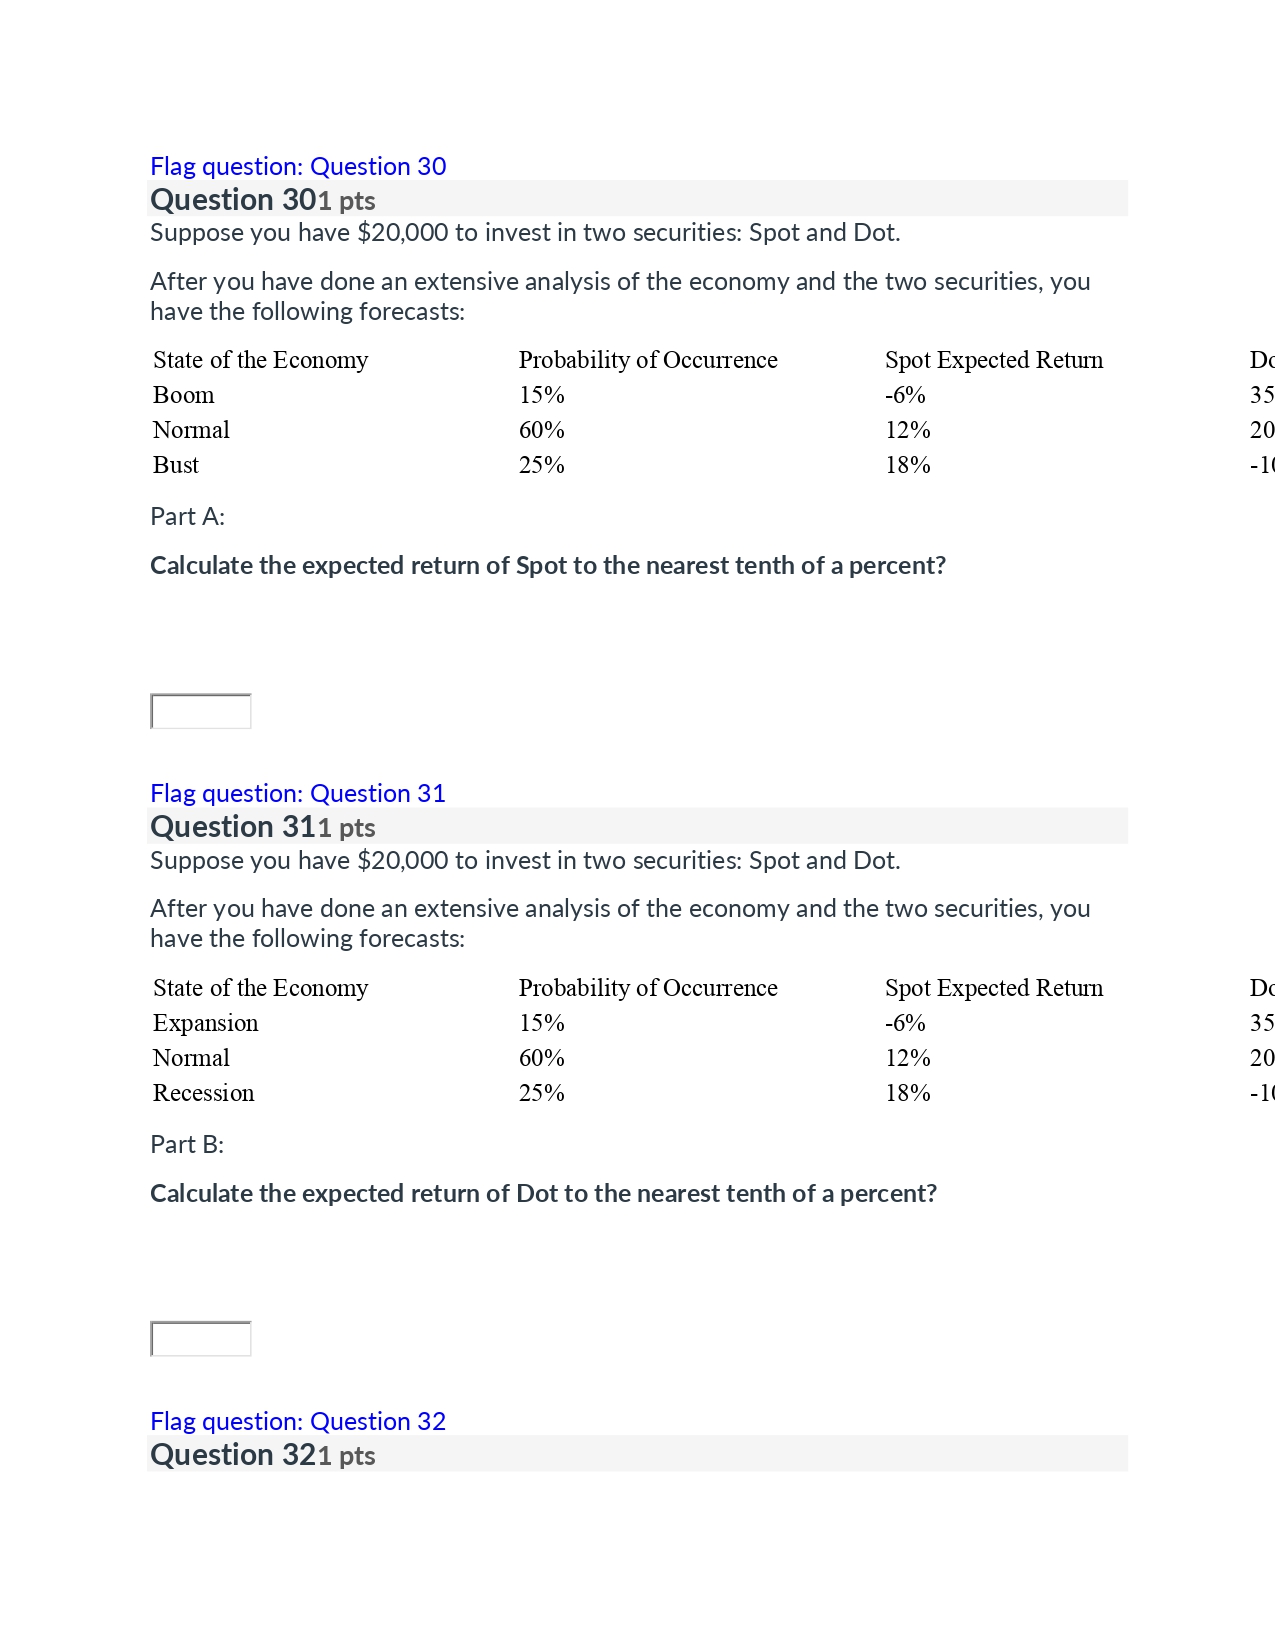
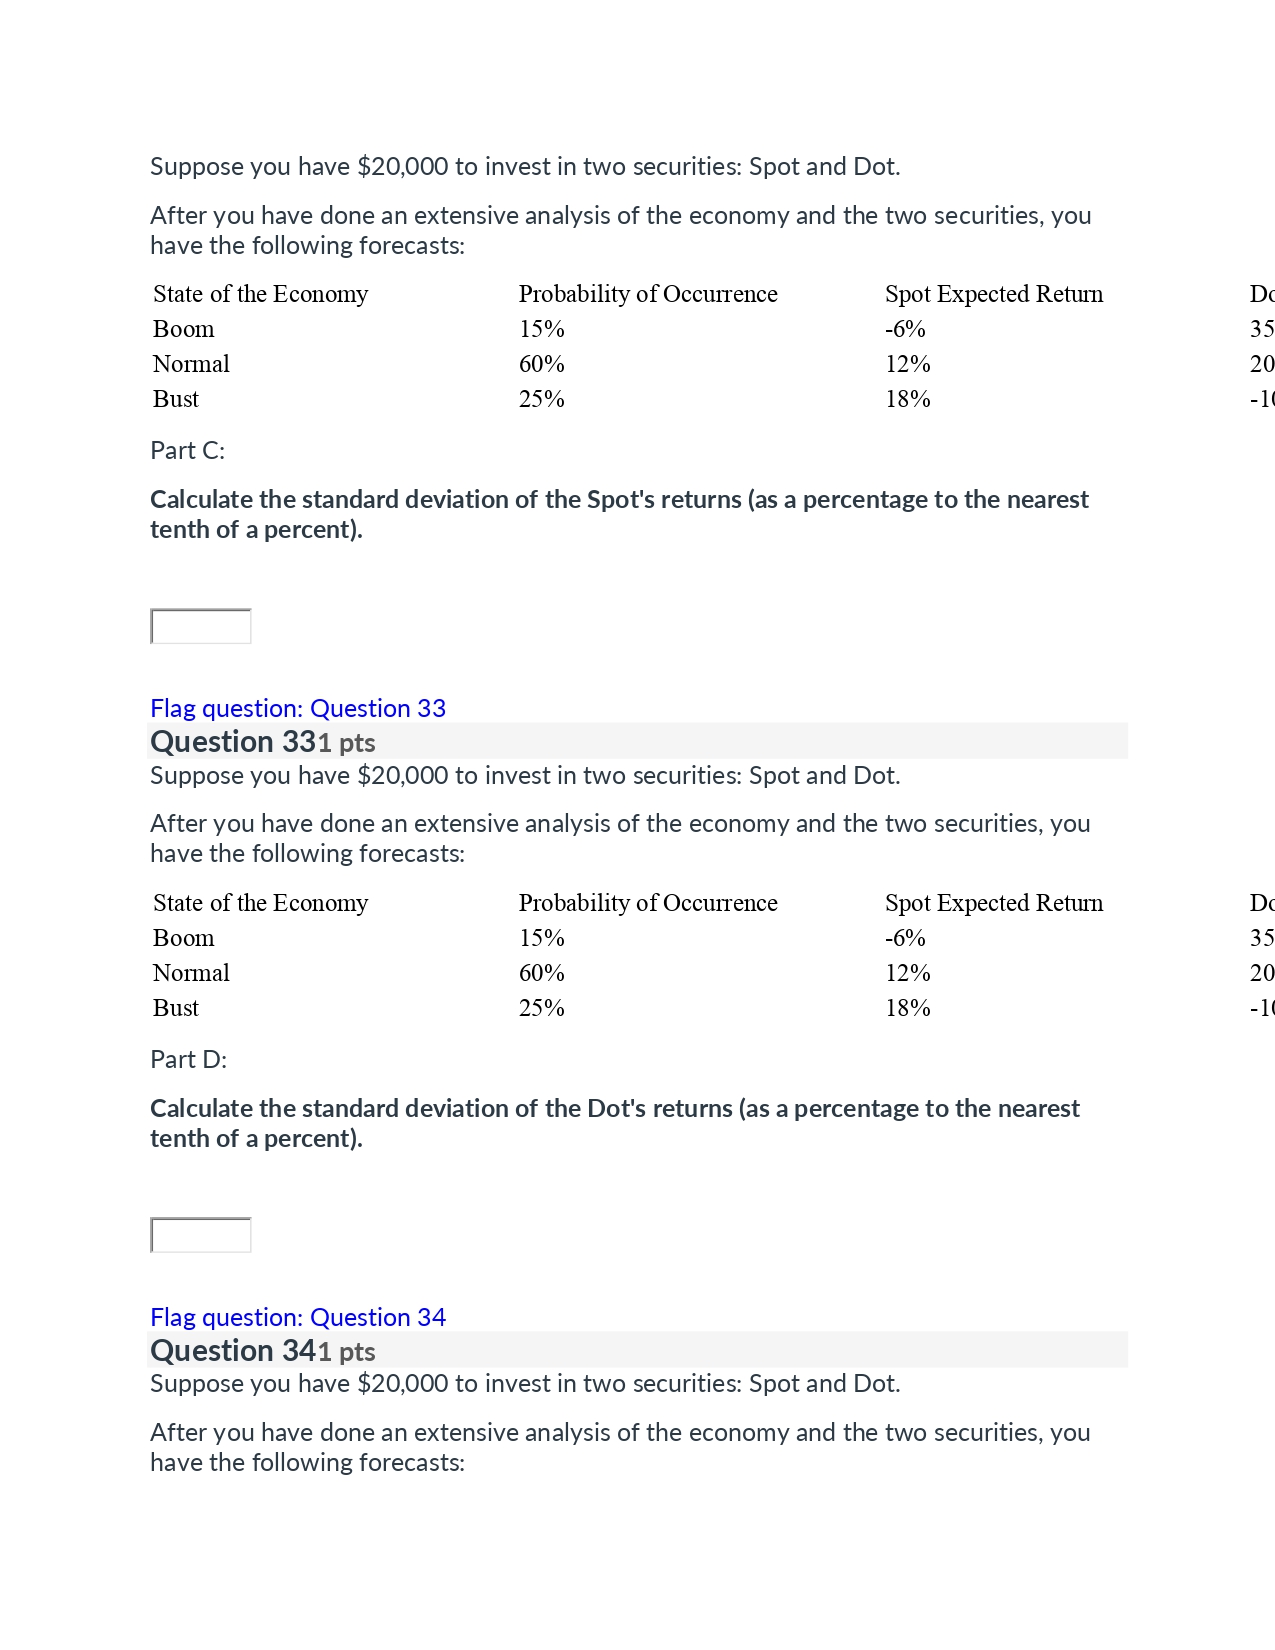
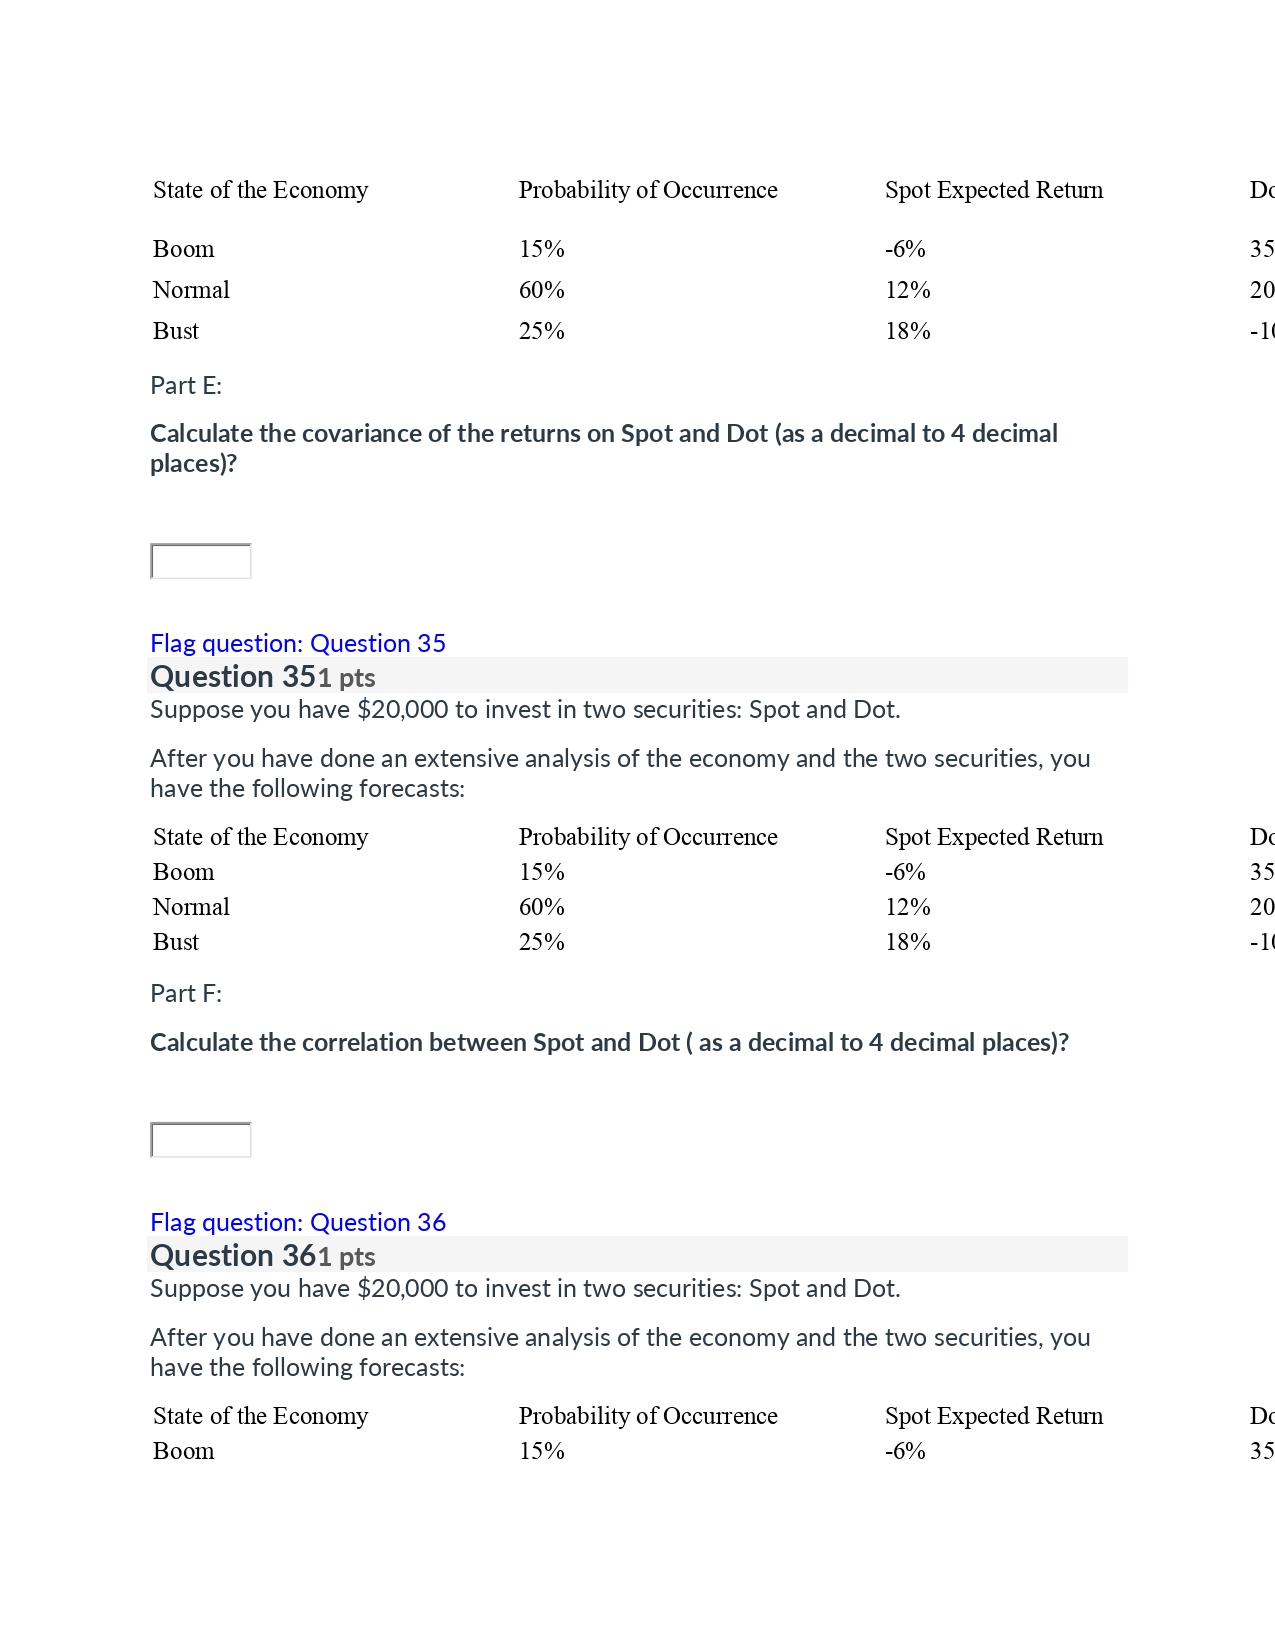
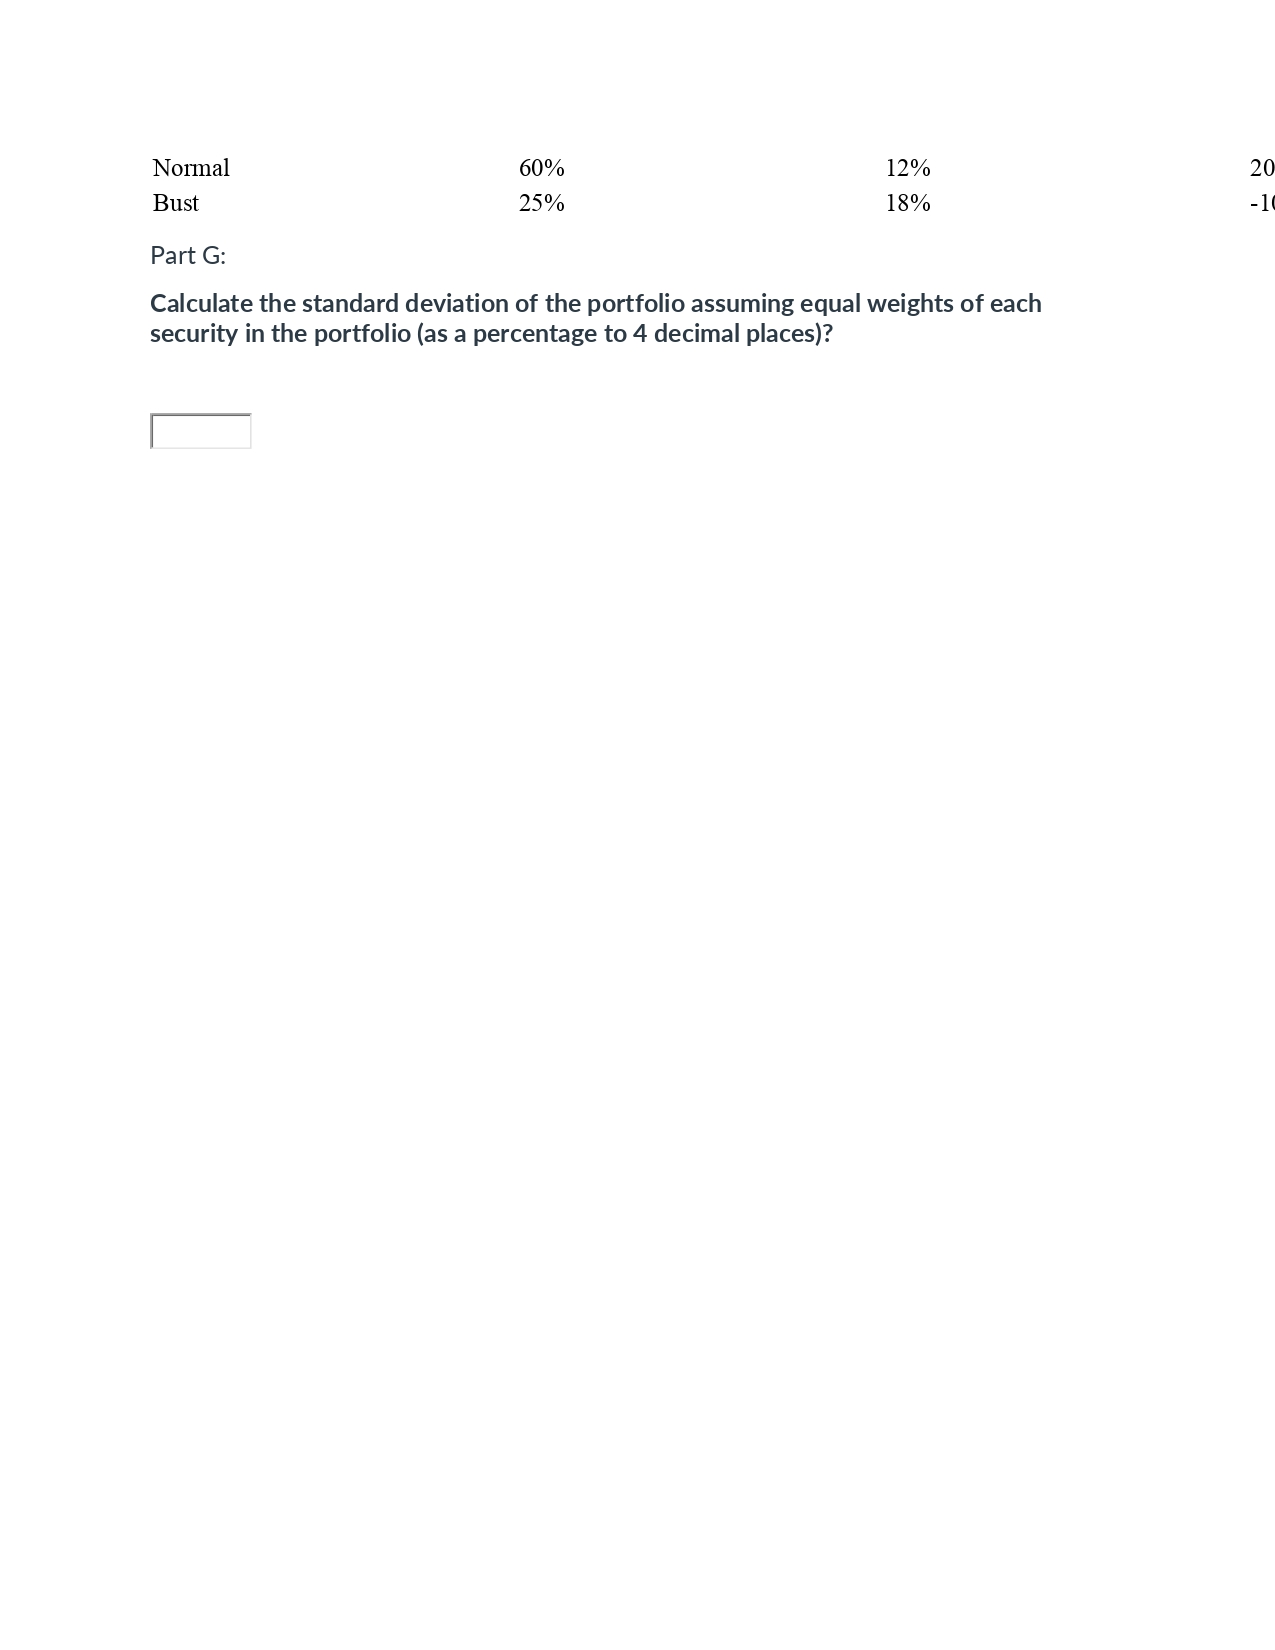
Question 71 pts What is the expected return for a portfolio that has $800 invested in Stock A and $1,200 invested in Stock B, if the expected returns on Stock A and Stock B are 10% and 18%, respectively? Group of answer choices (" 14.00% I" 14.8 0% I" 13.20% 1" 12.60% Flag question: Question 8 Question 81 pts A portfolio consists of two securities: Nervy and Goofy. The expected return of Nervy is 12 percent with a standard deviation of 15 percent. The expected return of Goofy is 9 percent with a standard deviation of 10 percent. What is the portfolio standard deviation if 35 percent of the portfolio is in Nervy and the two securities have a correlation of 0.6? Group of answer choices I\" 9.02% 1" 10.52% 1'" 11.75% F\" 12.18% Flag question: Question 9 Question 91 pts A stock selling for $12.00 today and expected to pay a $1.50 dividend and capital gain of 5% over a year is supposed to sell at: Group of answer choices t' $ 13.50 F $ 14.10 r\" $ 12.60 (" $ 15.18 Flag question: Question 10 Question 101 pts Which of the following is a FALSE statement about the security market line (SML}? Group of answer choices (" It is upward sloping, which indicates that investors require a higher expected return on riskier securities. c' It represents the trade off between total risk and the required rate of return for any risky security. (.1 It indicates that the size of risk premium varies directly with a security's market risk, as measured by beta. F It implies that securities with betas less than the market beta of 1.0 are less risky than the "average" stock and will therefore have lower required rates of return. Flag question: Question 11 Question 111 pts You are given the following information on BillCo Ltd: Opening Price Closing Price 2013 $53.48 $5.00 $54.90 2014 $54.90 $5.50 $63.12 2015 $63.12 $6.00 $41.34 2016 $41.34 $6.50 $47.24 2017 $47.24 $7.00 $49.69 Part A: Calculate the total annual returns for each one of the five years (to the nearest percent} Do NOT use units, spaces or commas in your answer. i. 2013 f Flag question: Question 12 Question 121 pts Part A continued: Calculate the total annual returns for each one of the five years (to the nearest percent} Do NOT use units, spaces or commas in your answer. ii. 2014 f Flag question: Question 13 Question 131 pts Part A continued: Calculate the total annual returns for each one of the five years (to the nearest percent} Do NOT use units, spaces or commas in your answer. iii. 2015 f Flag question: Question 14 Question 141 pts Part A continued: Calculate the total annual returns for each one of the five years (to the nearest percent} Do NOT use units, spaces or commas in your answer. iv. 2016 f Flag question: Question 15 Question 151 pts Part A continued: Calculate the total annual returns for each one of the five years (to the nearest percent} Do NOT use units, spaces or commas in your answer. V. 2017 f Flag question: Question 16 Question 161 pts Part B: Calculate the arithmetic average annual return to 3 decimal places Do NOT use units, spaces or commas in your answer. f Flag question: Question 17 Question 171 pts Part C: Calculate the geometric average annual return to 4 decimal places Do NOT use units, spaces or commas in your answer. f Flag question: Question 18 Question 181 pts Part D: Calculate the variance of annual returns to 4 decimal places. Do NOT use units, spaces or commas in your answer. f Flag question: Question 19 Question 191 pts Part E: Calculate the standard deviation of annual returns to 4 decimal places Do NOT use units, spaces or commas in your answer. f Flag question: Question 20 Question 201 pts Use the following facts for this question and the three that follow. You are given the following forecasts for the economy and the Agile Company at the beginning of the year: State of the Economy Probability of Occurrence Expected Return Expansion 20% 20% During the year, you observed the following: Quarter Opening Price Dividend Closing Price January -March $14.72 $0.50 $15.32 April - June $15.32 $0.50 $16.50 July - September $16.50 $0.50 $16.18 October - December $16.18 $0.50 $16.76 Part A: Calculate the ex-ante expected return to the nearest tenth of a percent Do NOT use units, spaces or commas in your answer. f Flag question: Question 21 Question 211 pts Part B: Calculate the ex-ante standard deviation of returns to the nearest a hundredth of a percentage Do NOT use units, spaces or commas in your answer. f Flag question: Question 22 Question 221 pts Part C: Calculate the ex-post average return to the nearest hundredth of a percentage Do NOT use units, spaces or commas in your answer. f Flag question: Question 23 Question 231 pts Part D: Calculate the ex-post standard deviation of returns to 4 decimal points Do NOT use units, spaces or commas in your answer. f Flag question: Question 24 Question 241 pts Given the following information, what is the beta of Stock X to two decimal points. Hint: use this equation ( notation: z = Stock x} Do NOT use units, spaces or commas in your answer. [ Flag question: Question 25 Question 251 pts Use the following facts for this question and the three that follow. Stock ABC is currently selling for $16.72. It has just paid an annual dividend of $0.80 per share, which is expected to grow at 4.5 percent indefinitely. The risk-free rate is 6 percent. The expected return on the market portfolio is 14 percent with a standard deviation of 17 percent. Part A: Calculate the expected return on Stock ABC to the nearest tenth of a percent ? Do NOT use units, spaces or commas in your answer. I Flag question: Question 26 Question 261 pts Part B: Is Stock ABC overpriced, underpriced, or correctly priced if it has a beta of 0.6? . YOUFAI'ISWEF: [ml ml mull [Salect] TI 1 1 Flag question: Question 27 Question 271 pts Part C: Is Stock ABC above, below, or on the SML? . YourAnswer: [ml ml mull [SEIECt] : 1 3 Flag question: Question 28 Question 281 pts Part D: What is the equilibrium price of Stock ABC to the nearest cent? Assume the dividend grow rate remains at 4.5 percent. Do NOT use units, spaces or commas in your answer. l Flag question: Question 29 Question 290 pts Suppose you have $20,000 to invest in two securities: Spot and Dot. After you have done an extensive analysis of the economy and the two securities, you have the following forecasts: State of the Economy Probability of Occurrence Spot Expected Return Boom 15% -6% Normal 60% 12% Bust 25% 18% 1. What are the expected returns on Spot and Dot? Expected return on Spot: l % Expected return on Dotzl % 2. What are the standard deviations of the returns on Spot and Dot? Spot's standard deviation: % Dot's standard deviation: l % 3. What is the covariance of the returns on Spot and Dot? The covariance of the returns on Spot and Dot: l 4. What is the correlation between Spot and Dot? The correlation between Spot and Dot: l 5. What is the standard deviation of the portfolio? The portfolio standard deviation: l % Please note that the next question will ask you to explain your process and show your work for your answer to this question. Dc 35 20 -ll Flag question: Question 30 Question 301 pts Suppose you have $20,000 to invest in two securities: Spot and Dot. After you have done an extensive analysis of the economy and the two securities, you have the following forecasts: State of the Economy Probability of Occurrence Spot Expected Return Boom 15% -6% Normal 60% 12% Bust 25% 18% Pa rt A: Calculate the expected return of Spot to the nearest tenth of a percent? f Flag question: Question 31 Question 311 pts Suppose you have $20,000 to invest in two securities: Spot and Dot. After you have done an extensive analysis of the economy and the two securities, you have the following forecasts: State of the Economy Probability of Occurrence Spot Expected Return Expansion 15% -6% Normal 60% 12% Recession 25% 18% Pa rt B: Calculate the expected return of Dot to the nearest tenth of a percent? r Flag question: Question 32 Question 321 pts Dr 35 20 -1I Dc 35 20 -1I Suppose you have $20,000 to invest in two securities: Spot and Dot. After you have done an extensive analysis of the economy and the two securities, you have the following forecasts: State of the Economy Probability of Occurrence Spot Expected Return Boom 15% -6% Normal 60% 12% Bust 25% 18% Pa rt C: Calculate the standard deviation of the Spot's returns (as a percentage to the nearest tenth of a percent). f Flag question: Question 33 Question 331 pts Suppose you have $20,000 to invest in two securities: Spot and Dot. After you have done an extensive analysis of the economy and the two securities, you have the following forecasts: State of the Economy Probability of Occurrence Spot Expected Return Boom 15% -6% Normal 60% 12% Bust 25% 18% Part D: Calculate the standard deviation of the Dot's returns (as a percentage to the nearest tenth of a percent). f Flag question: Question 34 Question 341 pts Suppose you have $20,000 to invest in two securities: Spot and Dot. After you have done an extensive analysis of the economy and the two securities, you have the following forecasts: Dc 35 20 -1! Dc 35 20 -1t State of the Economy Probability of Occurrence Spot Expected Return Boom 15% -6% Normal 60% 12% Bust 25% 18% Part E: Calculate the covariance of the returns on Spot and Dot (as a decimal to 4 decimal places)? f Flag question: Question 35 Question 351 pts Suppose you have $20,000 to invest in two securities: Spot and Dot. After you have done an extensive analysis of the economy and the two securities, you have the following forecasts: State of the Economy Probability of Occurrence Spot Expected Return Boom 15% -6% Normal 60% 12% Bust 25% 18% Pa rt F: Calculate the correlation between Spot and Dot ( as a decimal to 4 decimal places)? f Flag question: Question 36 Question 361 pts Suppose you have $20,000 to invest in two securities: Spot and Dot. After you have done an extensive analysis of the economy and the two securities, you have the following forecasts: State of the Economy Probability of Occurrence Spot Expected Return Boom 15% -6% Dc 35 20 -1I Dc 35 20 -1I Dc 35 Normal 60% 12% 20 Bust 25% 18% - 1 Part G: Calculate the standard deviation of the portfolio assuming equal weights of each security in the portfolio (as a percentage to 4 decimal places)
Step by Step Solution
There are 3 Steps involved in it
1 Expert Approved Answer
Step: 1 Unlock
Question Has Been Solved by an Expert!
Get step-by-step solutions from verified subject matter experts
Step: 2 Unlock
Step: 3 Unlock
Students Have Also Explored These Related Accounting Questions!