

Question: Question 8 1 Point The most appropriate method of graphing associations between two categorical variables include: A ) grouped histograms B scatterplots mosaic plots and

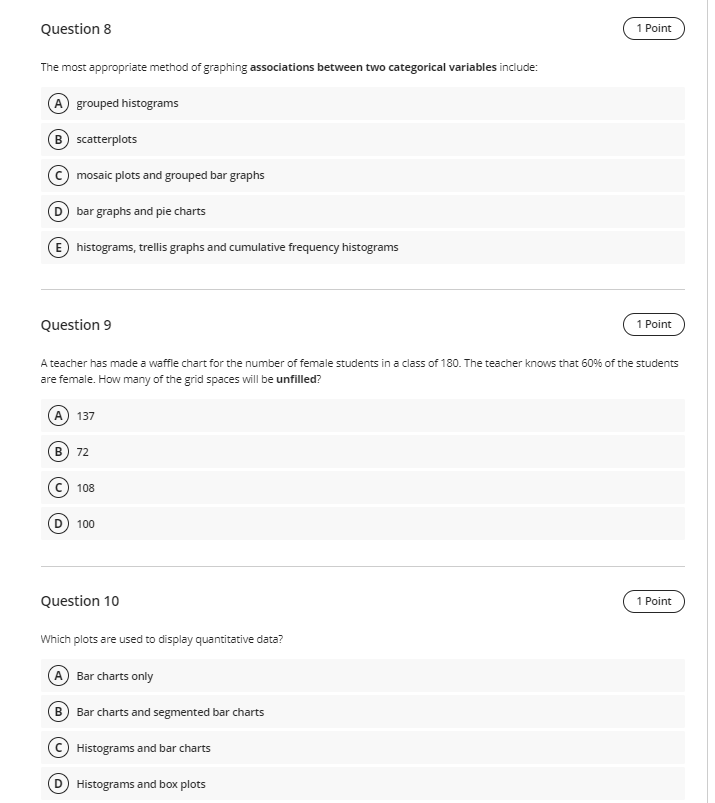
Question 8 1 Point The most appropriate method of graphing associations between two categorical variables include: A ) grouped histograms B scatterplots mosaic plots and grouped bar graphs D bar graphs and pie charts E histograms, trellis graphs and cumulative frequency histograms Question 9 1 Point A teacher has made a waffle chart for the number of female students in a class of 180. The teacher knows that 60% of the students are female. How many of the grid spaces will be unfilled? A) 137 B) 72 (c) 108 (D) 100 Question 10 1 Point Which plots are used to display quantitative data? A) Bar charts only B Bar charts and segmented bar charts C) Histograms and bar charts D) Histograms and box plots
Step by Step Solution
There are 3 Steps involved in it

Get step-by-step solutions from verified subject matter experts