

Question: Question 8 1 pts A candlestick chart for Coke is shown below. Which statement below is incorrect? 230.00 220.00 215.93 210.00 200.00 190.00 180.00 14
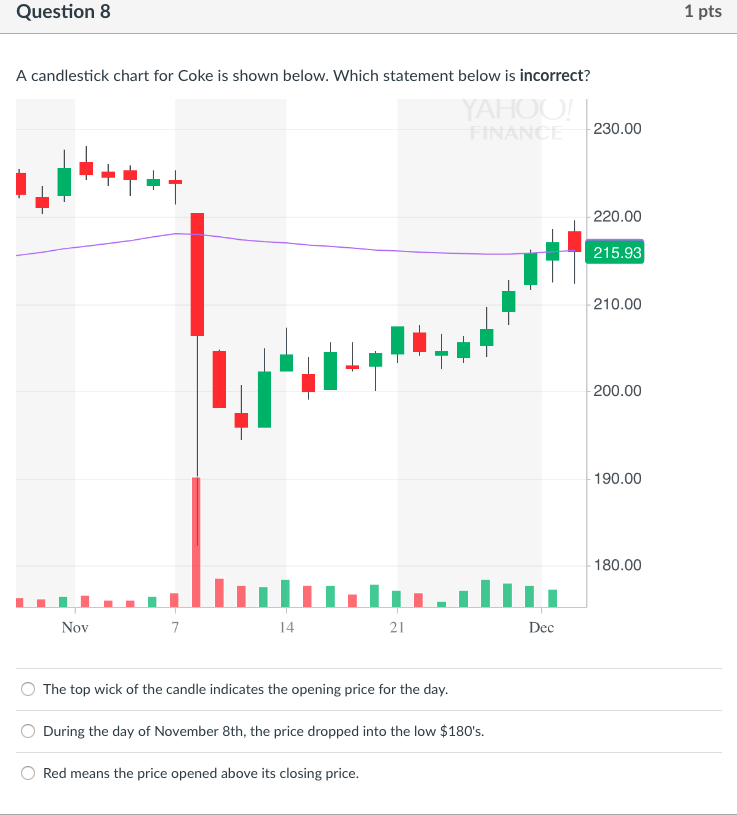
Question 8 1 pts A candlestick chart for Coke is shown below. Which statement below is incorrect? 230.00 220.00 215.93 210.00 200.00 190.00 180.00 14 21 Dec The top wick of the candle indicates the opening price for the day. O During the day of November 8th, the price dropped into the low $180's. O Red means the price opened above its closing price
Step by Step Solution
There are 3 Steps involved in it
1 Expert Approved Answer
Step: 1 Unlock

Question Has Been Solved by an Expert!
Get step-by-step solutions from verified subject matter experts
Step: 2 Unlock
Step: 3 Unlock