

Question: Question 8 [4 points) The following table shows the Average Australian Family weekly income from EDDIE) to 2010 [as reported by the Australian Bureau of
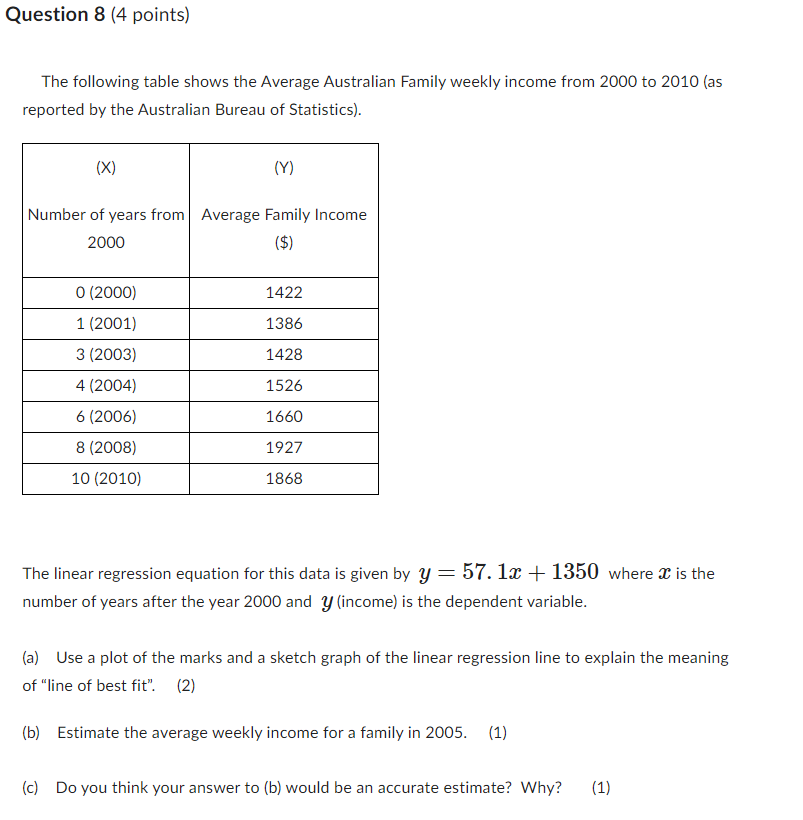

Question 8 [4 points) The following table shows the Average Australian Family weekly income from EDDIE) to 2010 [as reported by the Australian Bureau of Statistics}. Number of years from Average Family Income mm 10 [2U1El} 186E! The linear regression equation for this data is given by y 2 57.13? + 1350 where a: is the number of years after the year 2000 and y {income} is the dependent variable. {a} Use a plot of the marks and a sketch graph of the linear regression line to explain the meaning of "line of best fit\". [2} [hi Estimate the average weekly income for a family in EDGE. {1} (c) Do you think your answer to {b} would be an accurate estimate? Why? {1}
Step by Step Solution
There are 3 Steps involved in it

Get step-by-step solutions from verified subject matter experts