

Question: Question 8 { 8 marks Still using the data in xwales.mwx, the equation of the regression line for the relationship between the percentage of M140
Question 8 { 8 marks
Still using the data in xwales.mwx, the equation of the regression line for
the relationship between the percentage of M140 students studying for a
Maths and Stats degree and year is
y = 984:2 - 0:482x
where y is the percentage of M140 students studying for a Stats
degree and x is the year.
(a) Obtain and state the Pearson correlation coefficient for the relationship
between the percentage of students studying for a Maths and Stats
degree and the year. What does this tell you about the strength of the
linear relationship? [2]
(b) Produce a residual plot for the least squares regression line, and include
it in your answer. What does the residual plot indicate about the fit of
the least squares regression line? Justify your opinion. [3]
(c) Your manager has asked you to predict the percentage of students
studying for a Maths and Stats degree in 2020. Give one reason in
favour of using this regression line to predict the percentage for 2020
and give two reasons against
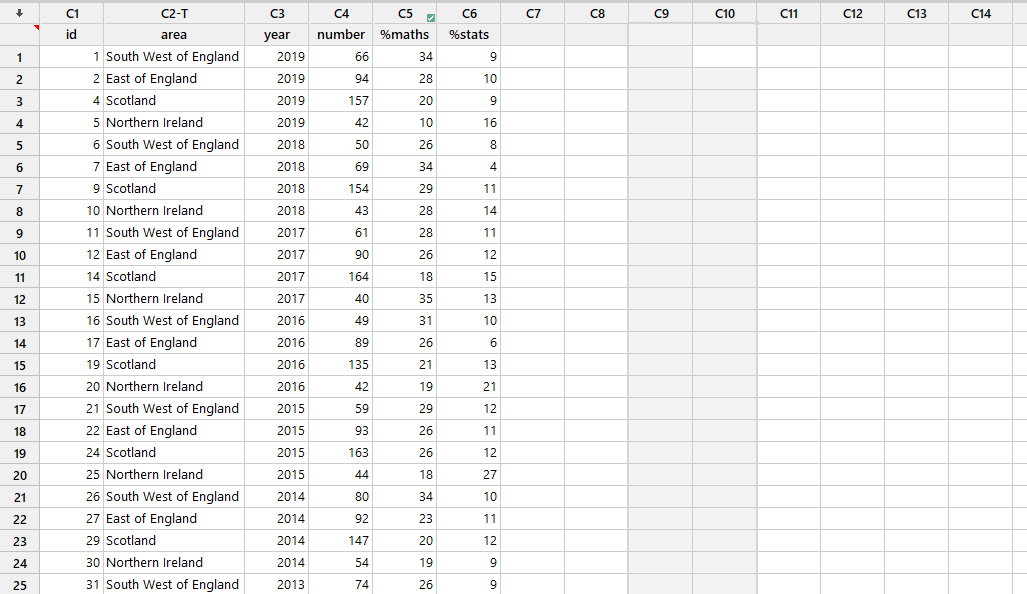
C1 C2-T C3 C4 C5 V C6 C7 C8 C9 C10 C11 C12 C13 C14 id area year number %maths %stats 1 South West of England 2019 66 34 9 2 2 East of England 2019 94 28 10 3 4 Scotland 2019 157 20 9 A 5 Northern Ireland 2019 42 10 16 6 South West of England 2018 50 26 8 7 East of England 2018 69 34 4 7 9 Scotland 2018 154 29 11 8 10 Northern Ireland 2018 43 28 14 9 11 South West of England 2017 61 28 11 10 12 East of England 2017 90 26 12 11 14 Scotland 2017 164 18 15 12 15 Northern Ireland 2017 40 35 13 13 16 South West of England 2016 49 31 10 14 17 East of England 2016 89 26 6 15 19 Scotland 2016 135 21 13 16 20 Northern Ireland 2016 42 19 21 17 21 South West of England 2015 59 29 12 18 22 East of England 2015 93 26 11 19 24 Scotland 2015 163 26 12 20 25 Northern Ireland 2015 44 18 27 21 26 South West of England 2014 80 34 10 22 27 East of England 2014 92 23 11 23 29 Scotland 2014 147 20 12 24 30 Northern Ireland 2014 54 19 9 25 31 South West of England 2013 74 26 g
Step by Step Solution
There are 3 Steps involved in it

Get step-by-step solutions from verified subject matter experts