

Question: Question 8, Bus Econ 5.14.85 E Homework: Section 5.8 Homework Part 1 of 2 Using production and geological data, the management of an oil company
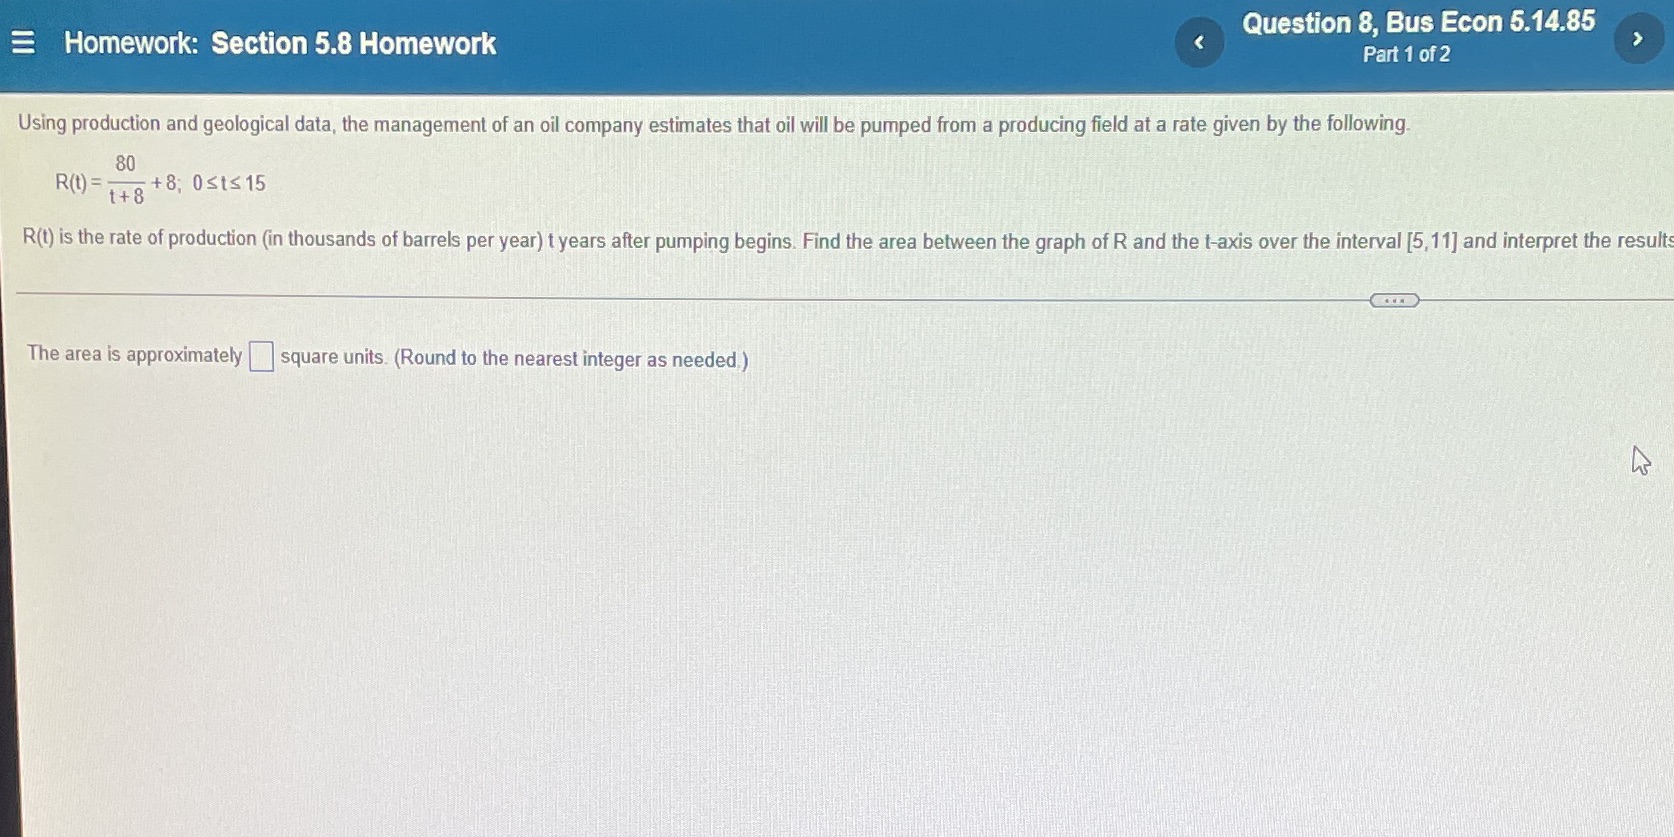

Question 8, Bus Econ 5.14.85 E Homework: Section 5.8 Homework Part 1 of 2 Using production and geological data, the management of an oil company estimates that oil will be pumped from a producing field at a rate given by the following. 80 R(t) = t + 8 o +8, Osts 15 R(t) is the rate of production (in thousands of barrels per year) t years after pumping begins. Find the area between the graph of R and the t-axis over the interval [5,11] and interpret the result The area is approximately |square units. (Round to the nearest integer as needed.)
Step by Step Solution
There are 3 Steps involved in it
1 Expert Approved Answer
Step: 1 Unlock

Question Has Been Solved by an Expert!
Get step-by-step solutions from verified subject matter experts
Step: 2 Unlock
Step: 3 Unlock