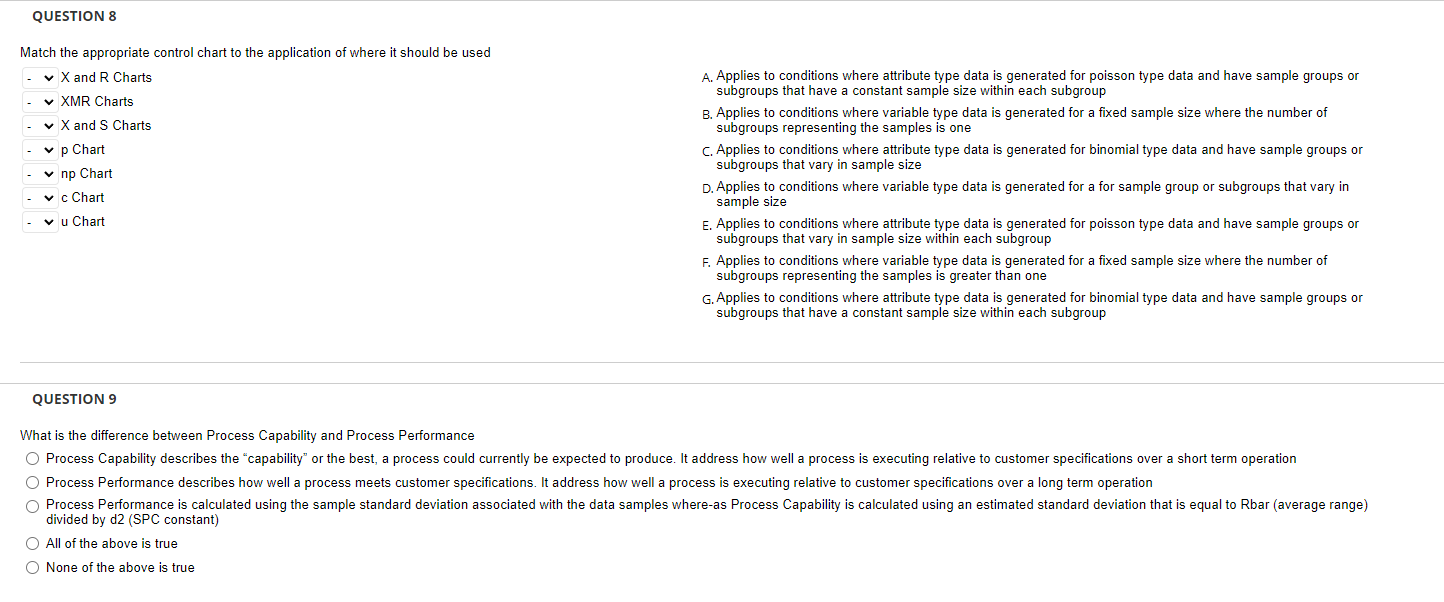
Question: QUESTION 8 Match the appropriate control chart to the application of where it should be used X and R Charts A. Applies to conditions where

QUESTION 8 Match the appropriate control chart to

QUESTION 8 Match the appropriate control chart to the application of where it should be used X and R Charts A. Applies to conditions where attribute type data is generated for poisson type data and have sample groups or subgroups that have a constant sample size within each subgroup XMR Charts X and S Charts B. Applies to conditions where variable type data is generated for a fixed sample size where the number of subgroups representing the samples is one - p Chart C. Applies to conditions where attribute type data is generated for binomial type data and have sample groups or subgroups that vary in sample size np Chart c Chart D. Applies to conditions where variable type data is generated for a for sample group or subgroups that vary in sample size u Chart E. Applies to conditions where attribute type data is generated for poisson type data and have sample groups or subgroups that vary in sample size within each subgroup F. Applies to conditions where variable type data is generated for a fixed sample size where the number of subgroups representing the samples is greater than one G.Applies to conditions where attribute type data is generated for binomial type data and have sample groups or subgroups that have a constant sample size within each subgroup QUESTION 9 What is the difference between Process Capability and Process Performance O Process Capability describes the "capability" or the best, a process could currently be expected to produce. It address how well a process is executing relative to customer specifications over a short term operation O Process Performance describes how well a process meets customer specifications. It address how well a process is executing relative to customer specifications over a long term operation O Process Performance is calculated using the sample standard deviation associated with the data samples where-as Process Capability is calculated using an estimated standard deviation that is equal to Rbar (average range) divided by d2 (SPC constant) O All of the above is true O None of the above is true

Step by Step Solution

There are 3 Steps involved in it

1 Expert Approved Answer
Step: 1 Unlock blur-text-image
Question Has Been Solved by an Expert!

Get step-by-step solutions from verified subject matter experts

Step: 2 Unlock
Step: 3 Unlock

Students Have Also Explored These Related General Management Questions!