

Question: question 8th-ed Chapter 11, Section 11.2, Problem 015 The October 2011 ISACA Shopping on the Job Survey asked employees, During the holiday season (November and
question
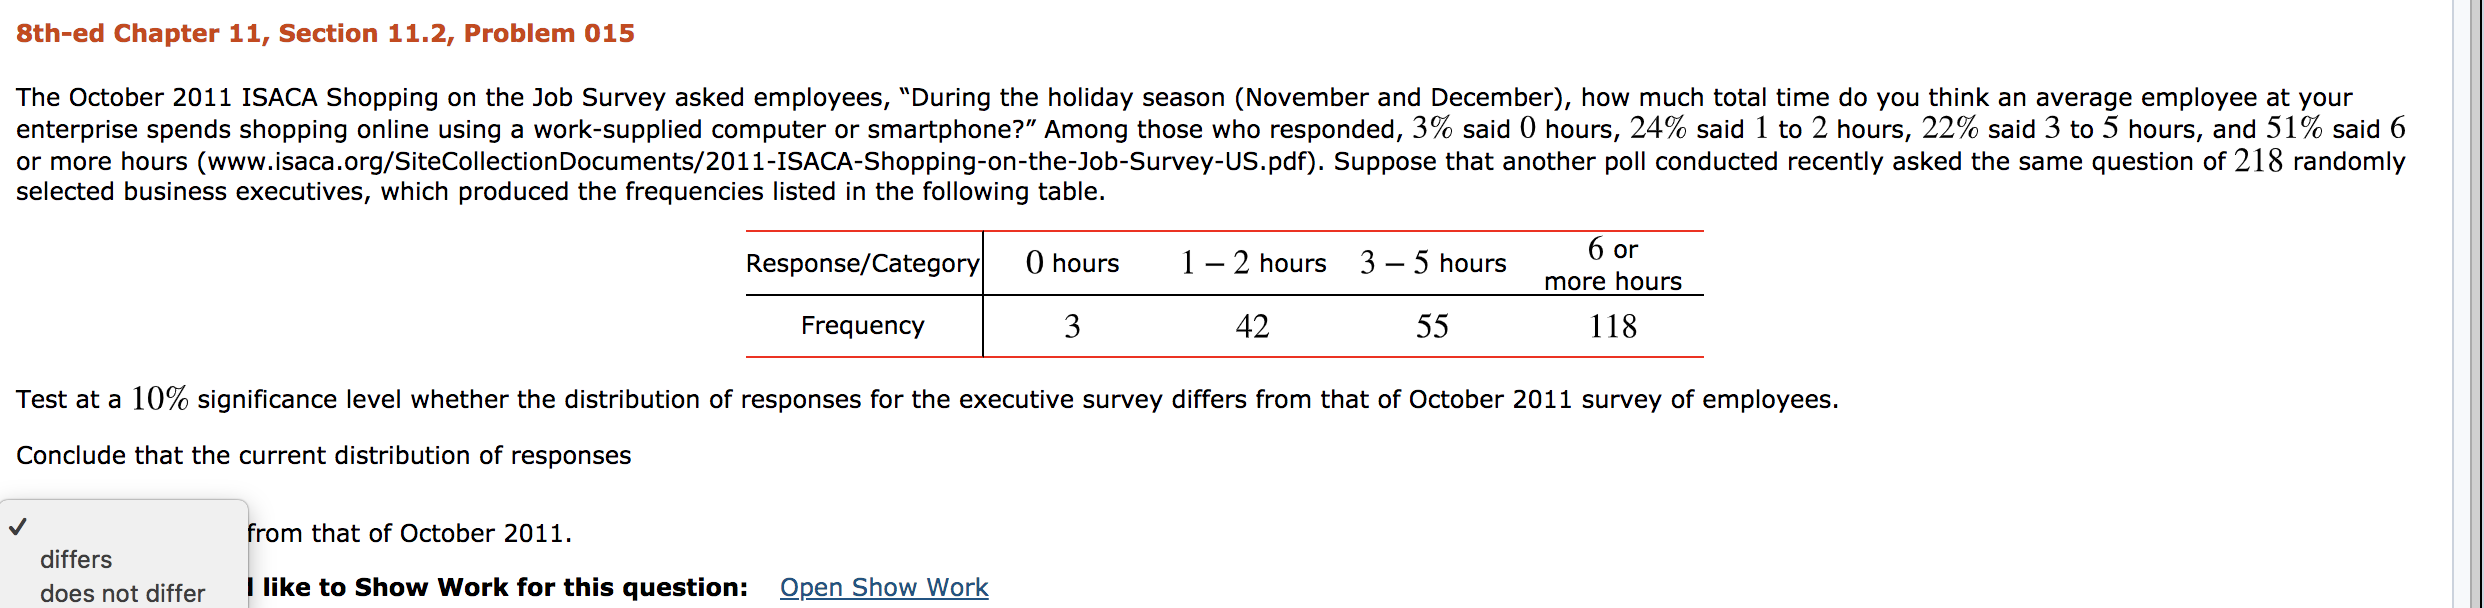
8th-ed Chapter 11, Section 11.2, Problem 015 The October 2011 ISACA Shopping on the Job Survey asked employees, "During the holiday season (November and December), how much total time do you think an average employee at your enterprise spends shopping online using a work-supplied computer or smartphone?" Among those who responded, 3% said 0 hours, 24% said 1 to 2 hours, 22% said 3 to 5 hours, and 51% said 6 or more hours (www.isaca.org/SiteCollectionDocuments/2011-ISACA-Shopping-on-the-Job-Survey-US.pdf). Suppose that another poll conducted recently asked the same question of 218 randomly selected business executives, which produced the frequencies listed in the following table. Response/Category 0 hours 1 - 2 hours 3 - 5 hours 6 or more hours Frequency 3 42 55 118 Test at a 10% significance level whether the distribution of responses for the executive survey differs from that of October 2011 survey of employees. Conclude that the current distribution of responses from that of October 2011. differs does not differ I like to Show Work for this question: Open Show Work
Step by Step Solution
There are 3 Steps involved in it

Get step-by-step solutions from verified subject matter experts