

Question: Question 9 (1 point) Continue from the previous question Labour Overhead Month Hours (X) Costs (Y) Jan 200 $415 Feb 175 $385 Mar 290 $520
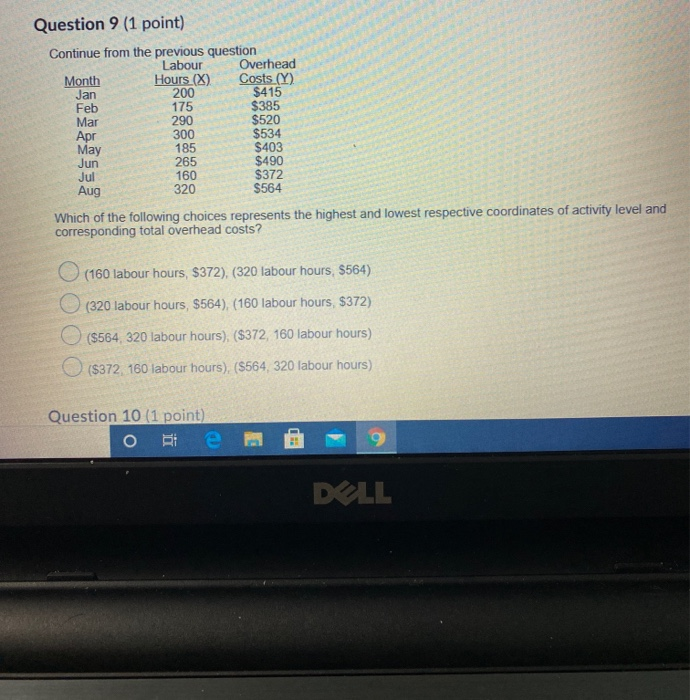
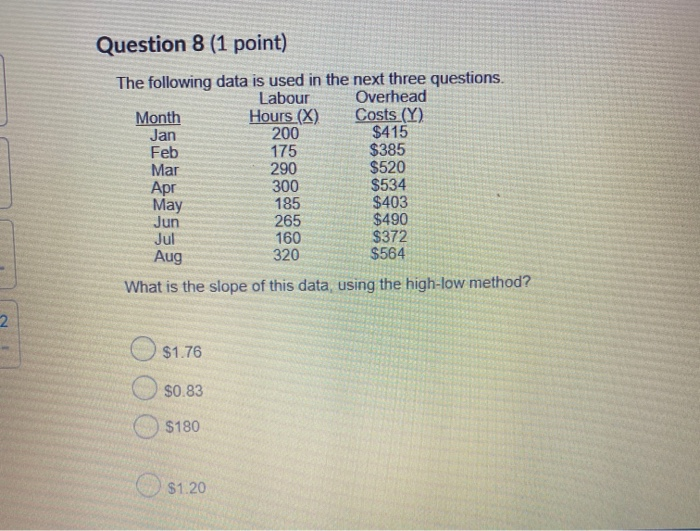
Question 9 (1 point) Continue from the previous question Labour Overhead Month Hours (X) Costs (Y) Jan 200 $415 Feb 175 $385 Mar 290 $520 Apr 300 $534 May 185 $403 Jun 265 $490 Jul 160 $372 Aug 320 $564 Which of the following choices represents the highest and lowest respective coordinates of activity level and corresponding total overhead costs? (160 labour hours, $372), (320 labour hours, S564) O (320 labour hours, $564), (160 labour hours, $372) ($564, 320 labour hours) ($372, 160 labour hours) ($372, 160 labour hours), ($564, 320 labour hours) Question 10 (1 point) o si e a DOLL Question 8 (1 point) The following data is used in the next three questions. Labour Overhead Month Hours (X) Costs (Y) Jan 200 $415 Feb 175 $385 Mar 290 $520 Apr 300 $534 May 185 $403 Jun 265 $490 Jul 160 $372 Aug 320 $564 What is the slope of this data, using the high-low method? 2 $1.76 $0.83 $180 $1.20 $
Step by Step Solution
There are 3 Steps involved in it

Get step-by-step solutions from verified subject matter experts