

Question: Question 9 1 pts The figure given below shows the production-possibility curves for Canada (AB) and the rest of the world (CD). Which of the

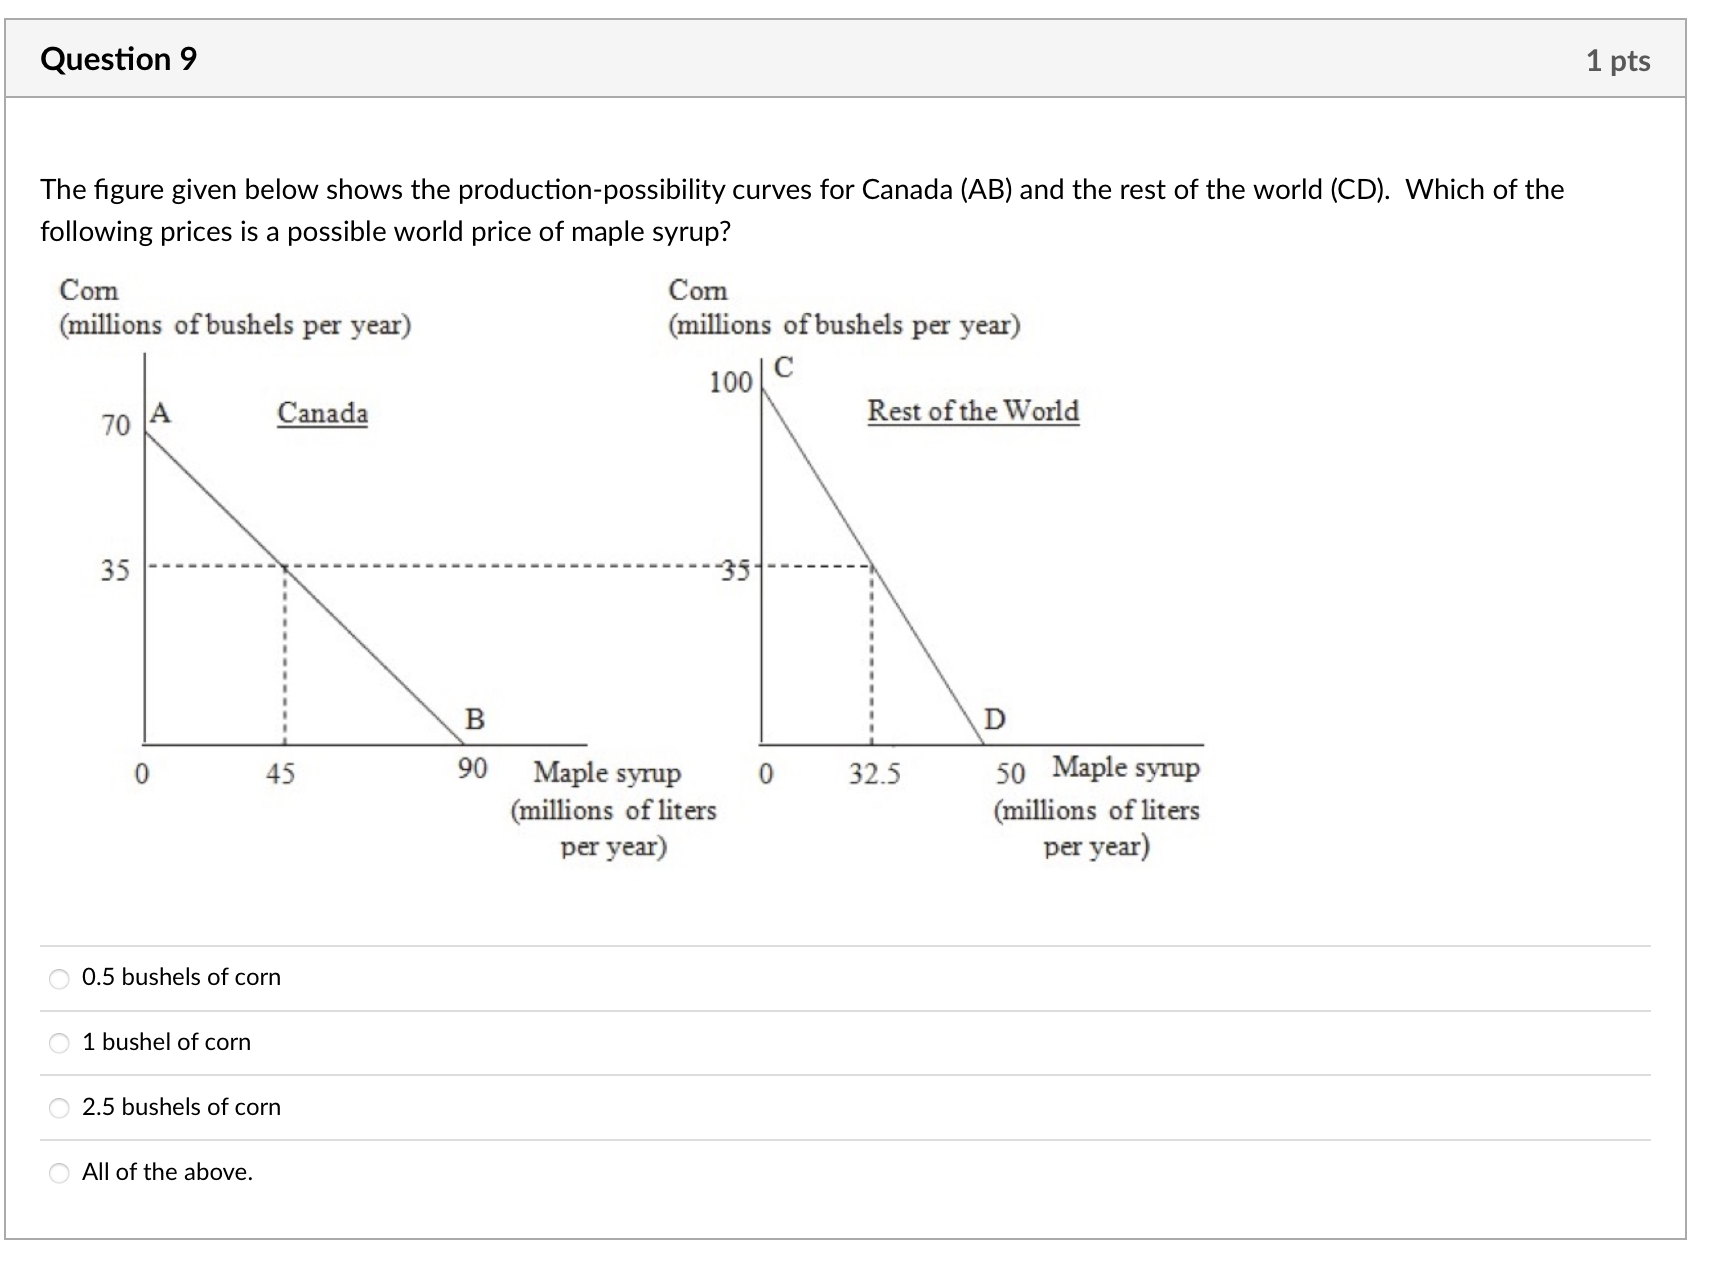
Question 9 1 pts The figure given below shows the production-possibility curves for Canada (AB) and the rest of the world (CD). Which of the following prices is a possible world price of maple syrup? Com Com (millions of bushels per year) (millions of bushels per year) 100 C 70 A Canada Rest of the World 35 - 35 B D 0 45 90 Maple syrup 0 32.5 50 Maple syrup (millions of liters (millions of liters per year) per year) 0.5 bushels of corn 1 bushel of corn 2.5 bushels of corn O All of the above
Step by Step Solution
There are 3 Steps involved in it
1 Expert Approved Answer
Step: 1 Unlock

Question Has Been Solved by an Expert!
Get step-by-step solutions from verified subject matter experts
Step: 2 Unlock
Step: 3 Unlock