

Question: Question 9 1 pts Using the FCF worksheet in the fsa_assignment.xlsx file on canvas, compute the firm's average free cash flow for the period 2016
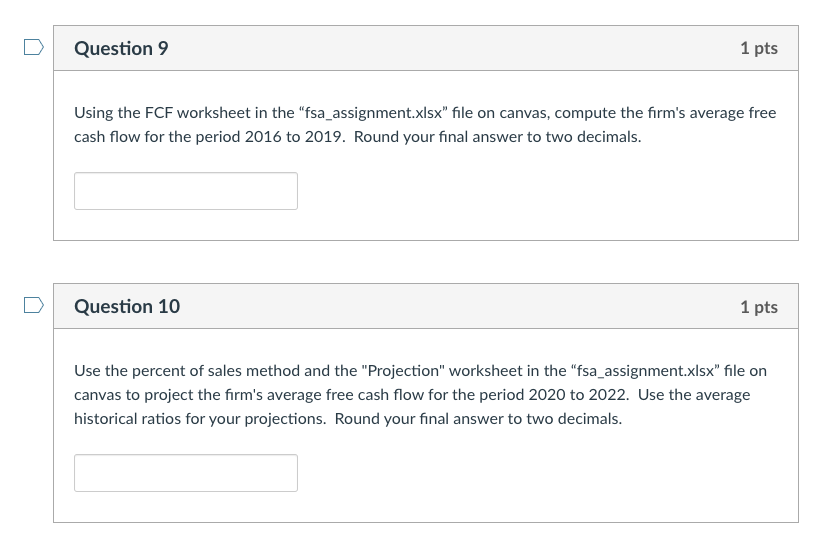
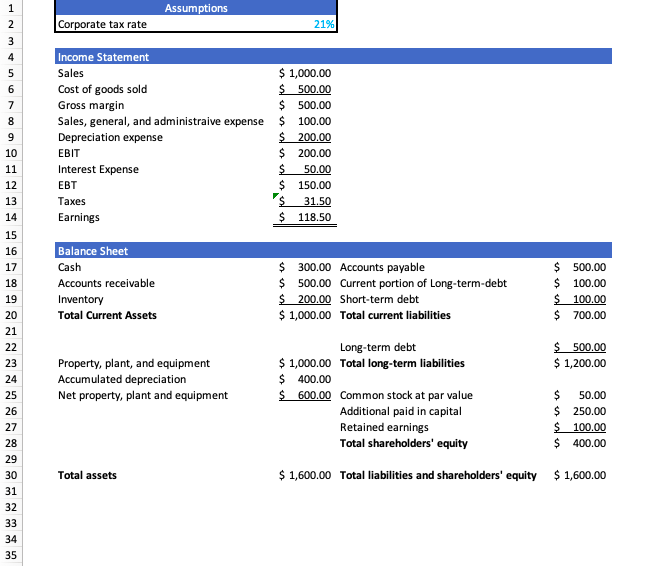
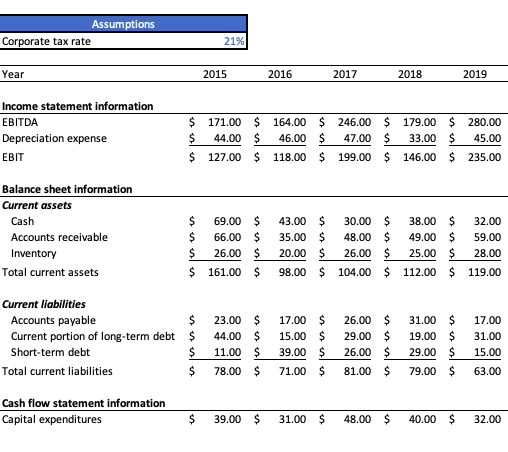
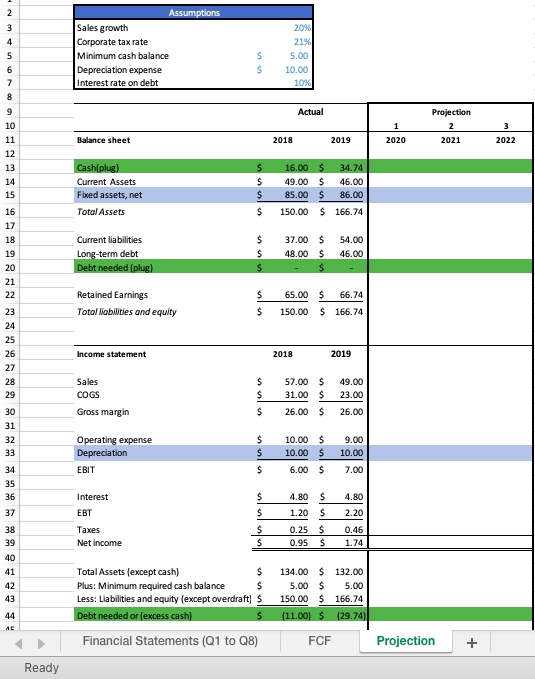
Question 9 1 pts Using the FCF worksheet in the "fsa_assignment.xlsx" file on canvas, compute the firm's average free cash flow for the period 2016 to 2019. Round your final answer to two decimals. Question 10 1 pts Use the percent of sales method and the "Projection" worksheet in the "fsa_assignment.xlsx" file on canvas to project the firm's average free cash flow for the period 2020 to 2022. Use the average historical ratios for your projections. Round your final answer to two decimals. Assumptions Corporate tax rate 21% 1 2 3 4 5 6 7 8 9 10 11 12 13 14 Income Statement Sales $ 1,000.00 Cost of goods sold $ 500.00 Gross margin $ 500.00 Sales, general, and administraive expense $ 100.00 Depreciation expense $ 200.00 EBIT $ 200.00 Interest Expense $ 50.00 EBT $ 150.00 Taxes 31.50 Earnings $ 118.50 15 16 17 18 Balance Sheet Cash Accounts receivable Inventory Total Current Assets $ 300.00 Accounts payable $ 500.00 Current portion of Long-term-debt $ 200.00 Short-term debt $ 1,000.00 Total current liabilities $ 500.00 $ 100.00 $ 100.00 $ 700.00 $ 500.00 $ 1,200.00 Property, plant, and equipment Accumulated depreciation Net property, plant and equipment 19 20 21 22 23 24 25 26 27 28 29 30 31 32 33 34 35 Long-term debt $ 1,000.00 Total long-term liabilities $ 400.00 $ 600.00 Common stock at par value Additional paid in capital Retained earnings Total shareholders' equity $ 50.00 $ 250.00 $ 100.00 $ 400.00 Total assets $ 1,600.00 Total liabilities and shareholders' equity $1,600.00 Assumptions Corporate tax rate 21% Year 2015 2016 2017 2018 2019 Income statement information EBITDA Depreciation expense EBIT $ 171.00 $ 44.00 $ 127.00 $ 164.00 $ 246.00 $ 179.00 $ 280.00 $ 46.00 $ 47.00 $ 33.00 $ 45.00 $ 118.00 $ 199.00 $ 146.00 $ 235.00 Balance sheet information Current assets Cash Accounts receivable Inventory Total current assets $ 69.00 $ 43.00 $ 30.00 $ 38.00 $ 32.00 $ 66.00 $ 35.00 $ 48.00 $ 49.00 $ 59.00 $ 26.00 $ 20.00 $ 26.00 $ 25.00 $ 28.00 $ 161.00 $ 98.00 $ 104.00 $ 112.00 $ 119.00 Current liabilities Accounts payable $ Current portion of long-term debt $ Short-term debt $ Total current liabilities $ 23.00 $ 44.00 $ 11.00 $ 78.00 $ 17.00 $ 15.00 $ 39.00 $ 71.00 $ 26.00 $ 29.00 $ 26.00 $ 81.00 $ 31.00 $ 19.00 $ 29.00 $ 79.00 $ 17.00 31.00 15.00 63.00 Cash flow statement information Capital expenditures $ 39.00 $ 31.00 $ 48.00 $ 40.00 $ 32.00 2 3 4 Assumptions Sales growth Corporate tax rate Minimum cash balance Depreciation expense Interest rate on debt 5 $ $ 20% 21% 5.00 10.00 10% 6 7 8 9 Actual 10 1 2020 Projection 2 2021 11 Balance sheet 2018 2019 2022 12 13 14 Cash[plug) Current Assets Fixed assets, net Total Assets $ $ $ $ 16.00 $ 34.74 49.00 $ 46.00 85.00 $ 86.00 150.00 $ 166.74 15 16 17 18 Current liabilities Long-term debt Debt needed (plug) $ $ $ 37.00 $ 48.00 $ $ 54.00 46.00 19 20 21 22 $ Retained Earnings Total liabilities and equity 65.00 $ 66.74 150.00 $ 166.74 23 $ 24 25 Income statement 2018 2019 26 27 28 29 Sales COGS Gross margin $ $ 57.00 $ 31.00 $ 26.00 $ 49.00 23.00 $ 26.00 30 31 32 33 Operating expense Depreciation EBIT $ $ $ 10.00 $ 10.00 $ 6.00 $ 9.00 10.00 34 7.00 35 36 37 Interest 4.80 2.20 $ $ $ $ 4.80 $ 1.20 $ 0.25$ 0.95 $ 38 39 Taxes Net income 0.46 1.74 40 41 $ $ 42 Total Assets (except cash) Plus: Minimum required cash balance Less: Liabilities and equity (except overdraft) $ Debt needed or (excess cash) $ Financial Statements (Q1 to 28) 134.00 $ 132.00 5.00 $ 5.00 150.00 $ 166.74 (11.00) 129.74) 43 44 AE FCF Projection + Ready Question 9 1 pts Using the FCF worksheet in the "fsa_assignment.xlsx" file on canvas, compute the firm's average free cash flow for the period 2016 to 2019. Round your final answer to two decimals. Question 10 1 pts Use the percent of sales method and the "Projection" worksheet in the "fsa_assignment.xlsx" file on canvas to project the firm's average free cash flow for the period 2020 to 2022. Use the average historical ratios for your projections. Round your final answer to two decimals. Assumptions Corporate tax rate 21% 1 2 3 4 5 6 7 8 9 10 11 12 13 14 Income Statement Sales $ 1,000.00 Cost of goods sold $ 500.00 Gross margin $ 500.00 Sales, general, and administraive expense $ 100.00 Depreciation expense $ 200.00 EBIT $ 200.00 Interest Expense $ 50.00 EBT $ 150.00 Taxes 31.50 Earnings $ 118.50 15 16 17 18 Balance Sheet Cash Accounts receivable Inventory Total Current Assets $ 300.00 Accounts payable $ 500.00 Current portion of Long-term-debt $ 200.00 Short-term debt $ 1,000.00 Total current liabilities $ 500.00 $ 100.00 $ 100.00 $ 700.00 $ 500.00 $ 1,200.00 Property, plant, and equipment Accumulated depreciation Net property, plant and equipment 19 20 21 22 23 24 25 26 27 28 29 30 31 32 33 34 35 Long-term debt $ 1,000.00 Total long-term liabilities $ 400.00 $ 600.00 Common stock at par value Additional paid in capital Retained earnings Total shareholders' equity $ 50.00 $ 250.00 $ 100.00 $ 400.00 Total assets $ 1,600.00 Total liabilities and shareholders' equity $1,600.00 Assumptions Corporate tax rate 21% Year 2015 2016 2017 2018 2019 Income statement information EBITDA Depreciation expense EBIT $ 171.00 $ 44.00 $ 127.00 $ 164.00 $ 246.00 $ 179.00 $ 280.00 $ 46.00 $ 47.00 $ 33.00 $ 45.00 $ 118.00 $ 199.00 $ 146.00 $ 235.00 Balance sheet information Current assets Cash Accounts receivable Inventory Total current assets $ 69.00 $ 43.00 $ 30.00 $ 38.00 $ 32.00 $ 66.00 $ 35.00 $ 48.00 $ 49.00 $ 59.00 $ 26.00 $ 20.00 $ 26.00 $ 25.00 $ 28.00 $ 161.00 $ 98.00 $ 104.00 $ 112.00 $ 119.00 Current liabilities Accounts payable $ Current portion of long-term debt $ Short-term debt $ Total current liabilities $ 23.00 $ 44.00 $ 11.00 $ 78.00 $ 17.00 $ 15.00 $ 39.00 $ 71.00 $ 26.00 $ 29.00 $ 26.00 $ 81.00 $ 31.00 $ 19.00 $ 29.00 $ 79.00 $ 17.00 31.00 15.00 63.00 Cash flow statement information Capital expenditures $ 39.00 $ 31.00 $ 48.00 $ 40.00 $ 32.00 2 3 4 Assumptions Sales growth Corporate tax rate Minimum cash balance Depreciation expense Interest rate on debt 5 $ $ 20% 21% 5.00 10.00 10% 6 7 8 9 Actual 10 1 2020 Projection 2 2021 11 Balance sheet 2018 2019 2022 12 13 14 Cash[plug) Current Assets Fixed assets, net Total Assets $ $ $ $ 16.00 $ 34.74 49.00 $ 46.00 85.00 $ 86.00 150.00 $ 166.74 15 16 17 18 Current liabilities Long-term debt Debt needed (plug) $ $ $ 37.00 $ 48.00 $ $ 54.00 46.00 19 20 21 22 $ Retained Earnings Total liabilities and equity 65.00 $ 66.74 150.00 $ 166.74 23 $ 24 25 Income statement 2018 2019 26 27 28 29 Sales COGS Gross margin $ $ 57.00 $ 31.00 $ 26.00 $ 49.00 23.00 $ 26.00 30 31 32 33 Operating expense Depreciation EBIT $ $ $ 10.00 $ 10.00 $ 6.00 $ 9.00 10.00 34 7.00 35 36 37 Interest 4.80 2.20 $ $ $ $ 4.80 $ 1.20 $ 0.25$ 0.95 $ 38 39 Taxes Net income 0.46 1.74 40 41 $ $ 42 Total Assets (except cash) Plus: Minimum required cash balance Less: Liabilities and equity (except overdraft) $ Debt needed or (excess cash) $ Financial Statements (Q1 to 28) 134.00 $ 132.00 5.00 $ 5.00 150.00 $ 166.74 (11.00) 129.74) 43 44 AE FCF Projection + Ready
Step by Step Solution
There are 3 Steps involved in it

Get step-by-step solutions from verified subject matter experts