

Question: .Question 9 Question 9 You generate a scatter plot using Excel. You then have Excel plot the trend line and report the equation and ther

.Question 9
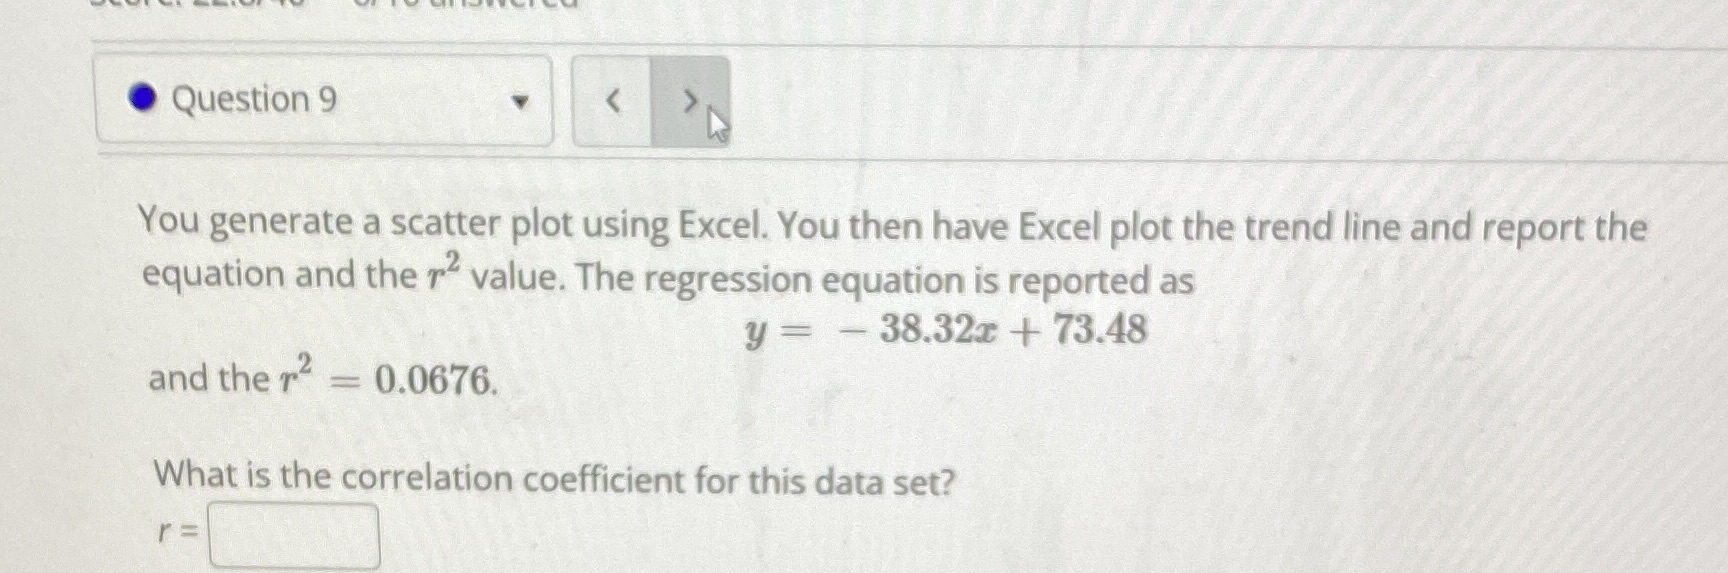
Question 9 You generate a scatter plot using Excel. You then have Excel plot the trend line and report the equation and ther value. The regression equation is reported as - 38.32x + 73.48 2 and the r 0.0676. What is the correlation coefficient for this data set?
Step by Step Solution
There are 3 Steps involved in it
1 Expert Approved Answer
Step: 1 Unlock

Question Has Been Solved by an Expert!
Get step-by-step solutions from verified subject matter experts
Step: 2 Unlock
Step: 3 Unlock