

Question: Question 9 3 pt The graph below shows the old age dependency ratios for three countries: Brazil, the United States, and Spain. Old Age Dependency
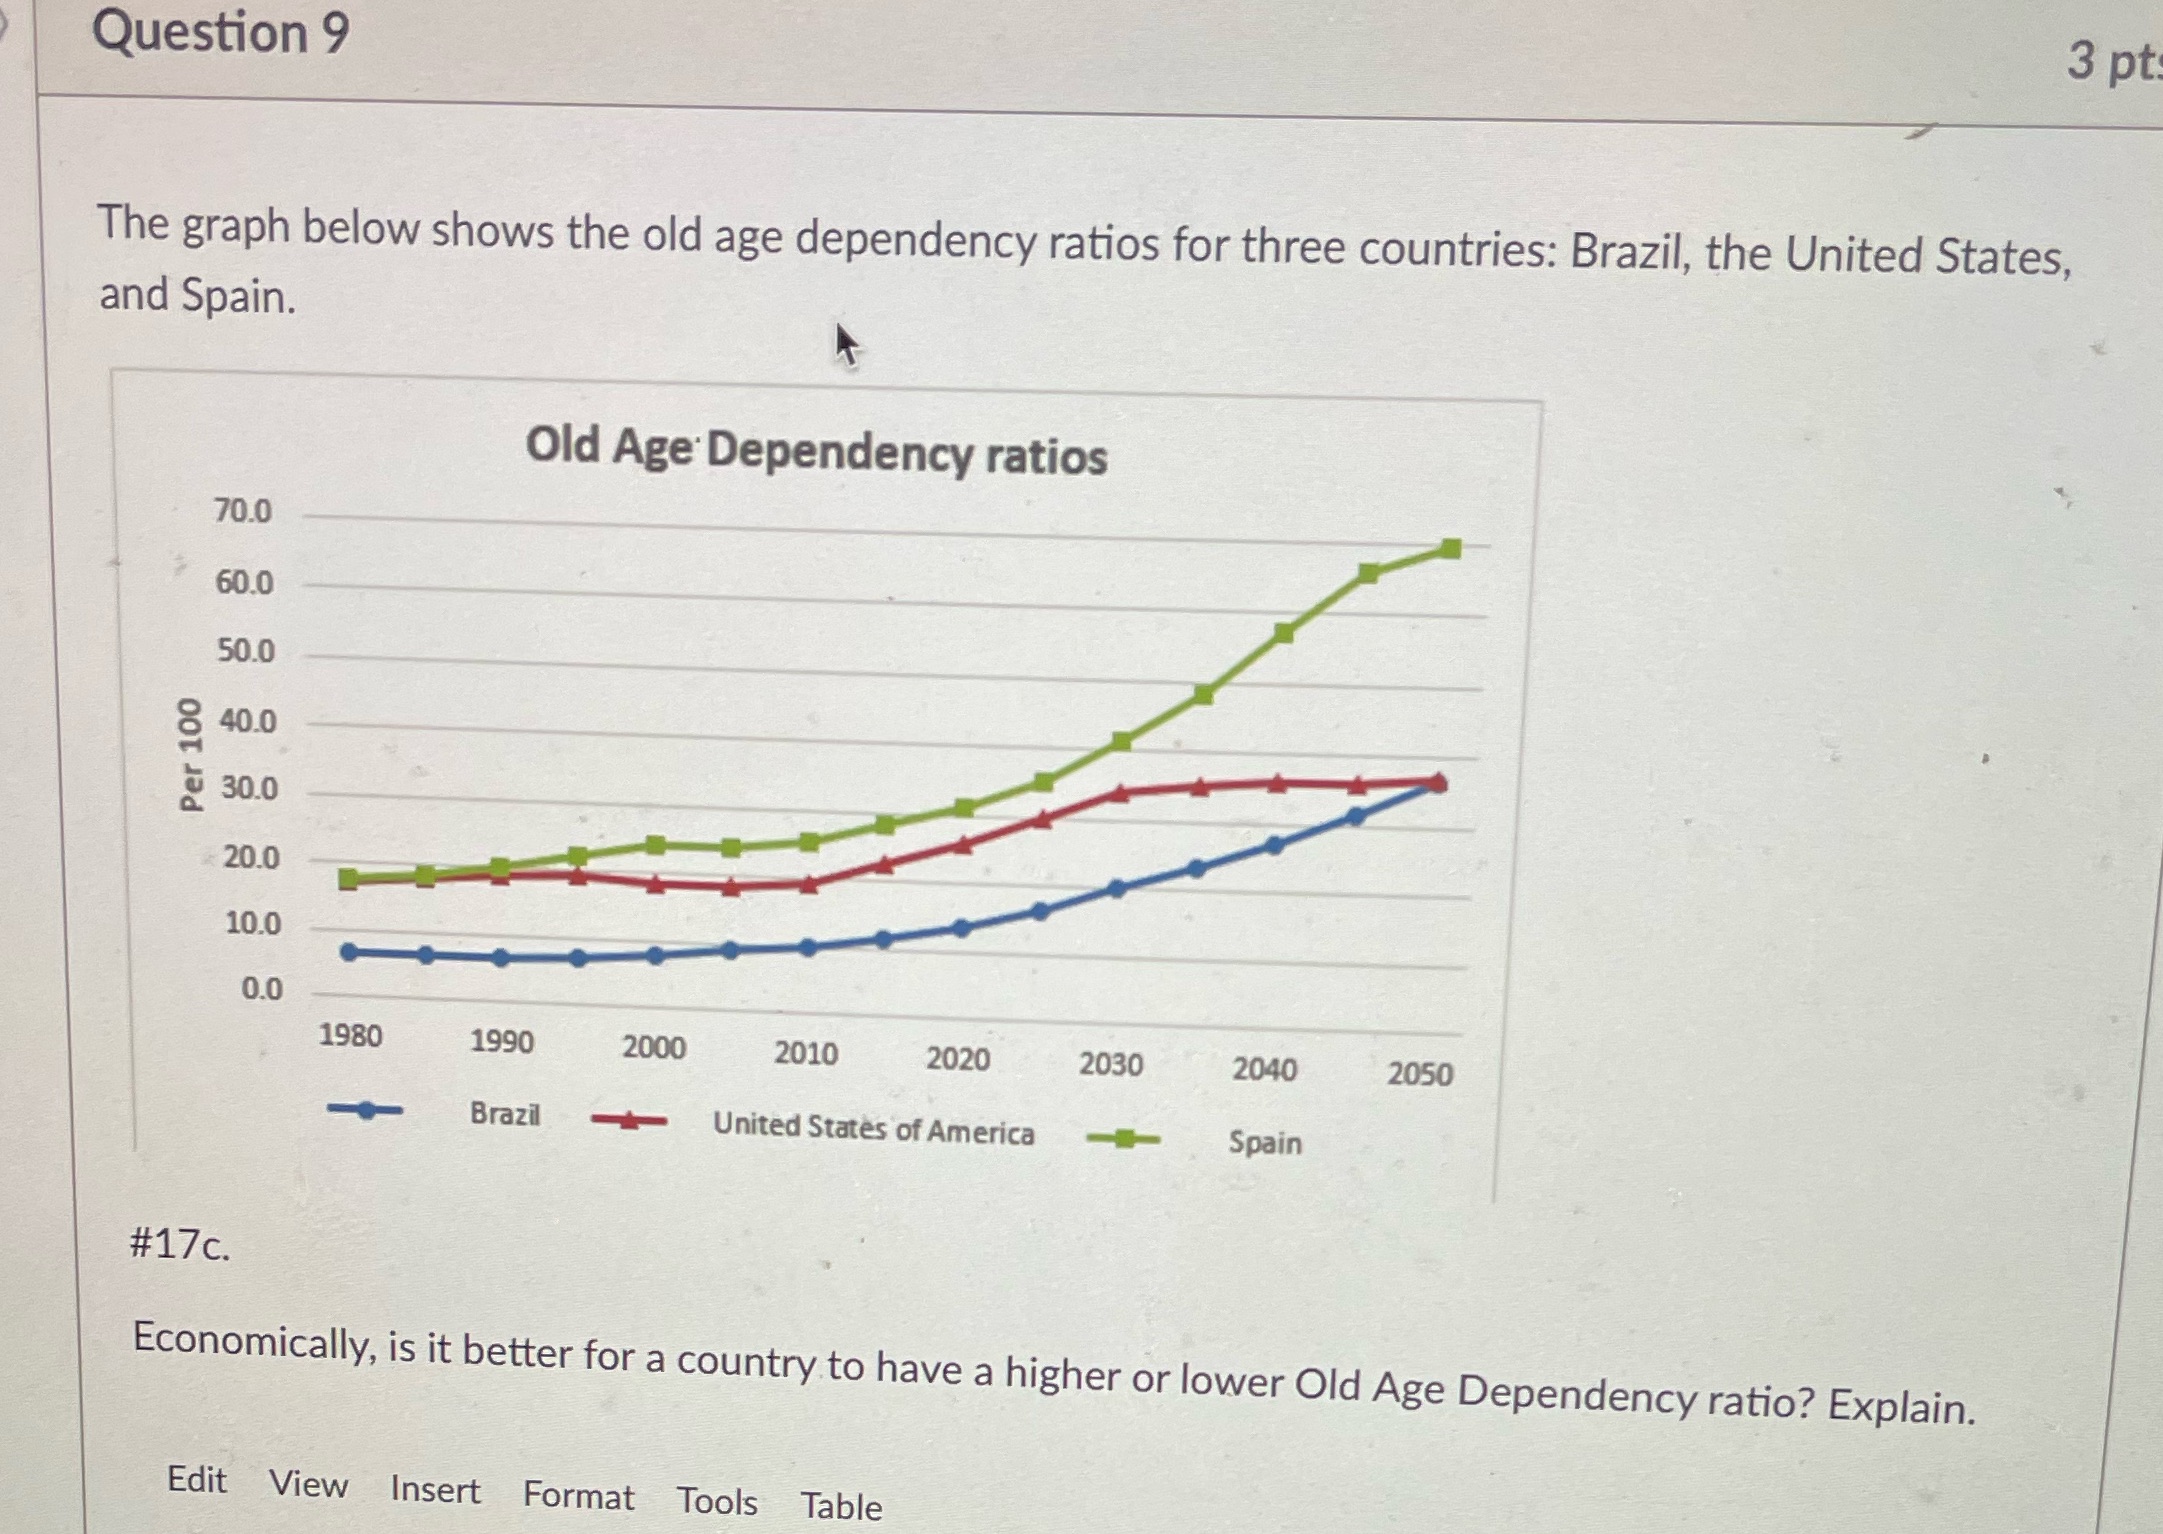
Question 9 3 pt The graph below shows the old age dependency ratios for three countries: Brazil, the United States, and Spain. Old Age Dependency ratios 70.0 60.0 50.0 40.0 Per 100 30.0 20.0 10.0 0.0 1980 1990 2000 2010 2020 2030 2040 2050 Brazil United States of America Spain #17c. Economically, is it better for a country to have a higher or lower Old Age Dependency ratio? Explain. Edit View Insert Format Tools Table
Step by Step Solution
There are 3 Steps involved in it
1 Expert Approved Answer
Step: 1 Unlock

Question Has Been Solved by an Expert!
Get step-by-step solutions from verified subject matter experts
Step: 2 Unlock
Step: 3 Unlock