

Question: Question 9 8 pts 1 0 Details Question #9 (8 points, 4 points each) 0 to 10 points. Each histogram below displays test scores for

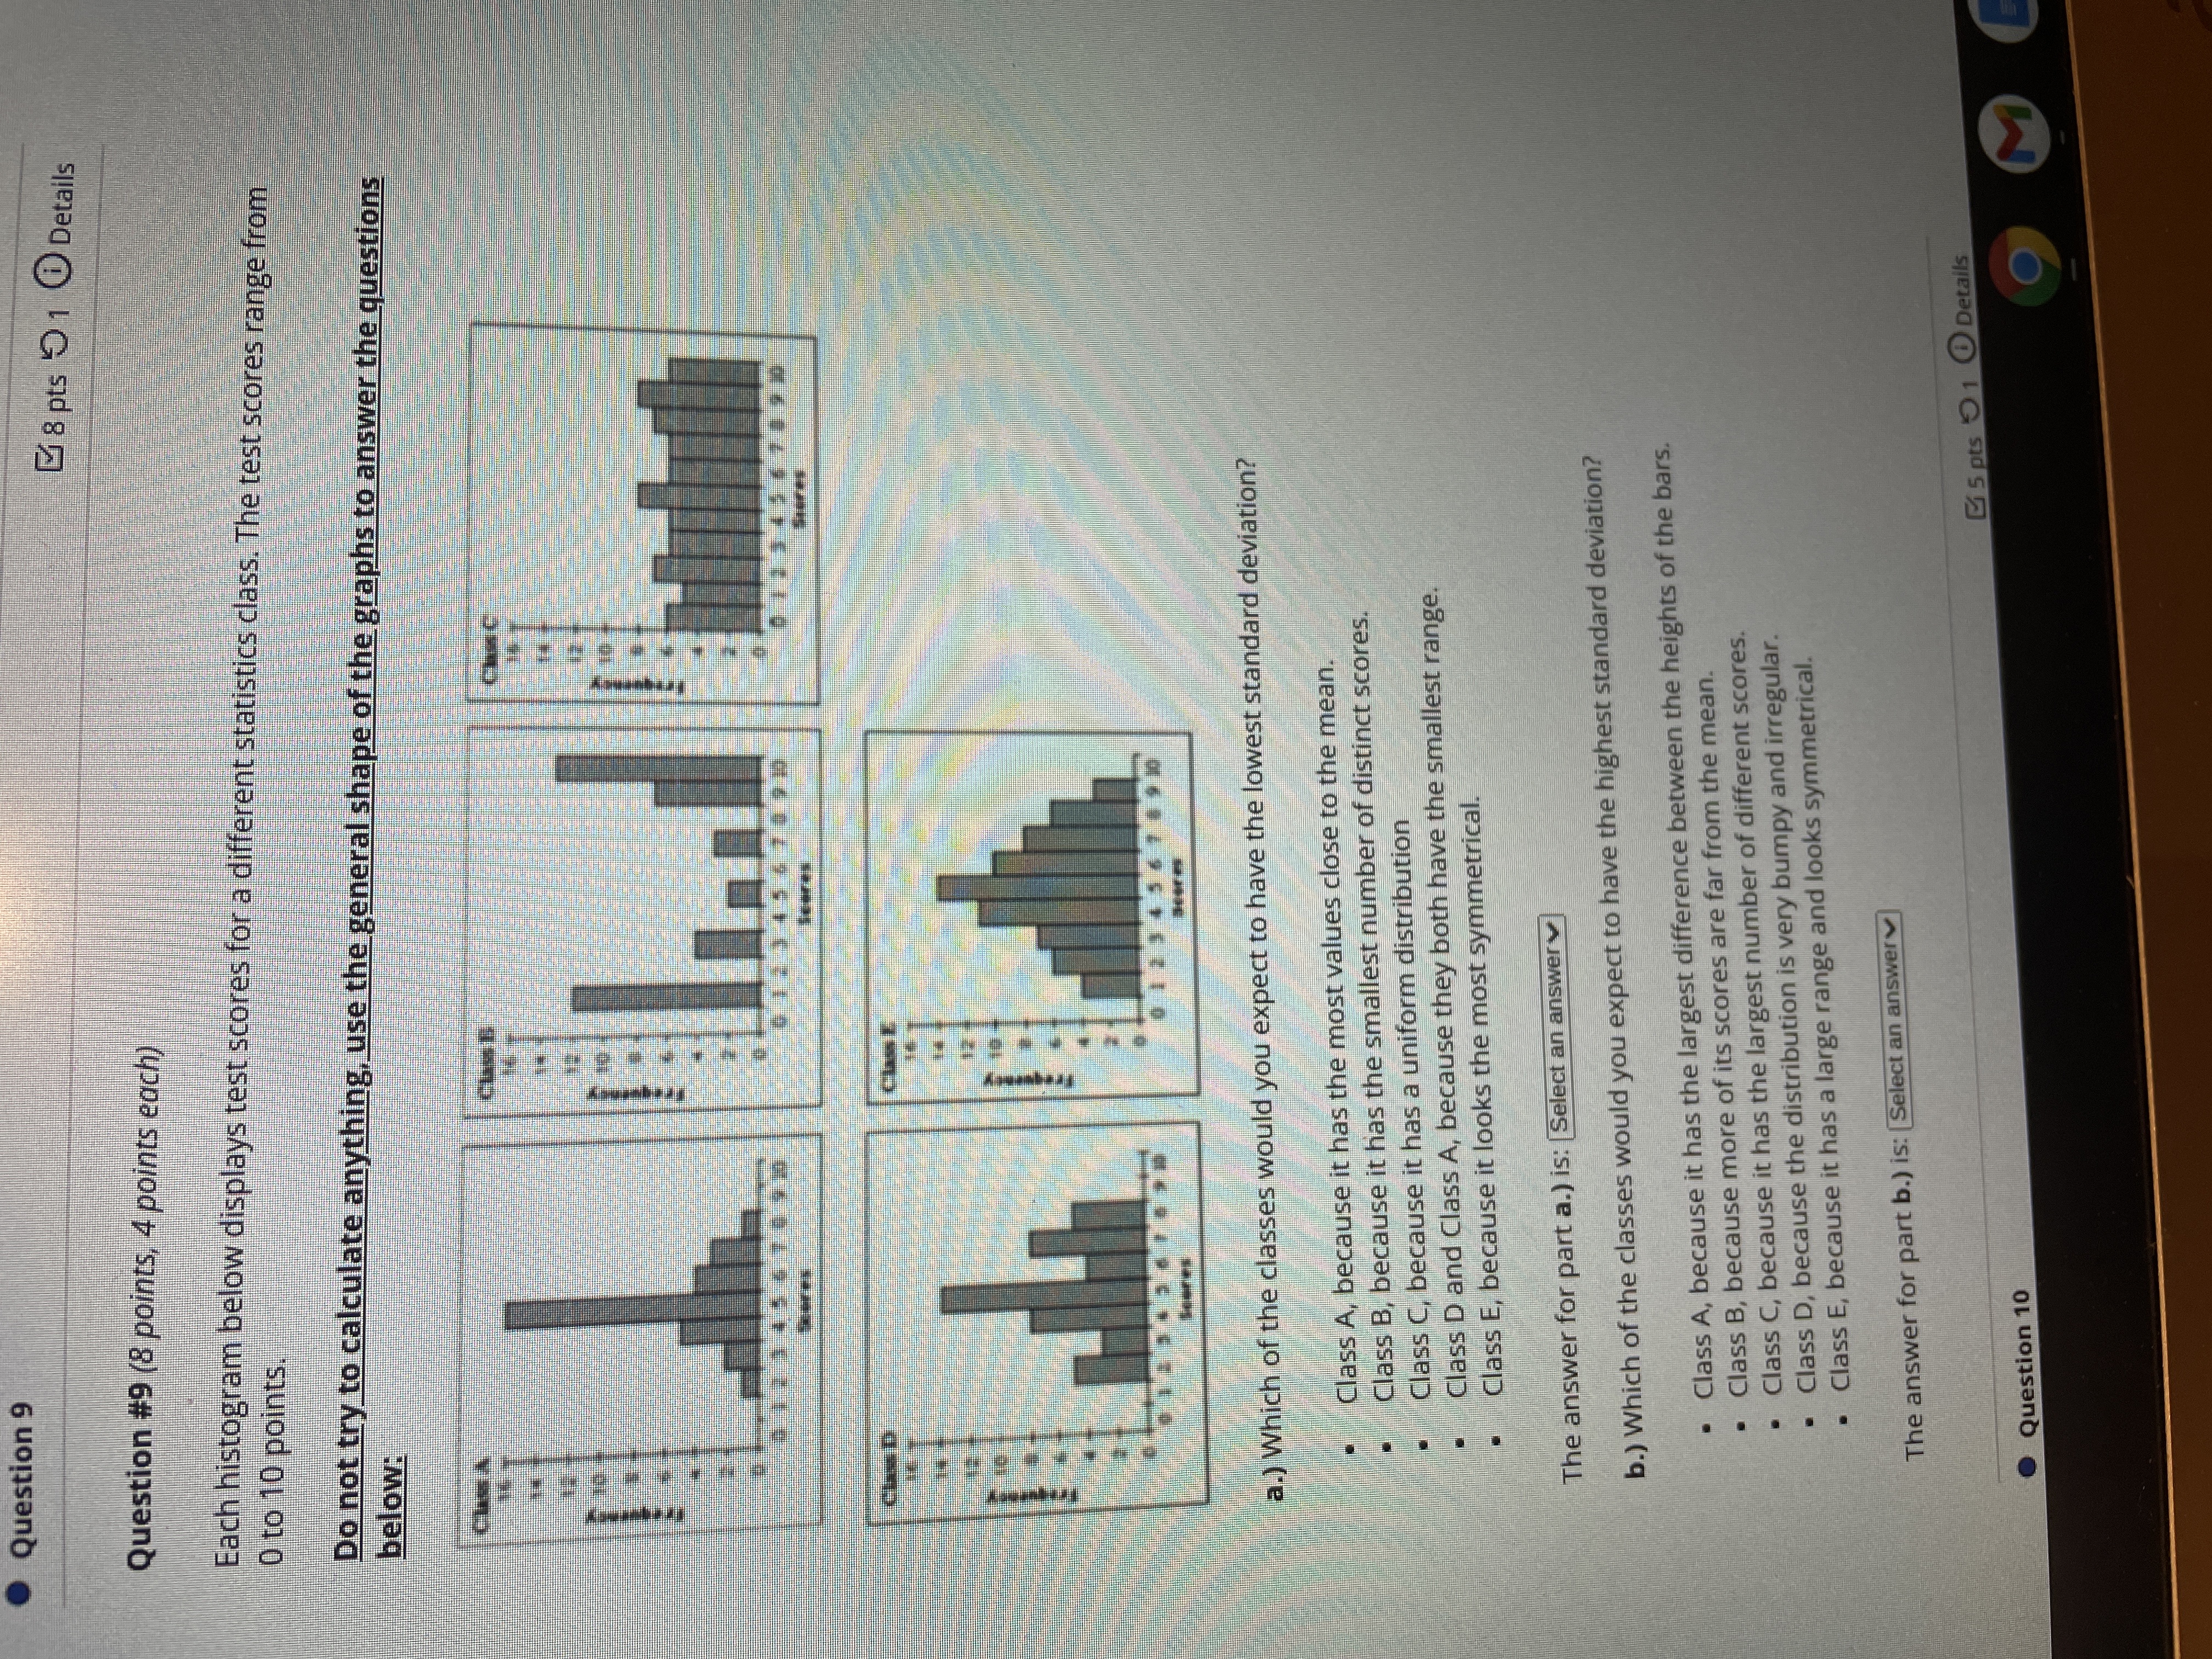
Question 9 8 pts 1 0 Details Question #9 (8 points, 4 points each) 0 to 10 points. Each histogram below displays test scores for a different statistics class. The test scores range from below: Do not try to calculate anything, use the general shape of the graphs to answer the questions a.) Which of the classes would you expect to have the lowest standard deviation? Class A, because it has the most values close to the mean. Class B, because it has the smallest number of distinct scores. Class C, because it has a uniform distribution Class D and Class A, because they both have the smallest range. Class E, because it looks the most symmetrical. The answer for part a.) is: [Select an answerv] b.) Which of the classes would you expect to have the highest standard deviation? Class A, because it has the largest difference between the heights of the bars. Class B, because more of its scores are far from the mean. Class C, because it has the largest number of different scores. Class D, because the distribution is very bumpy and irregular. Class E, because it has a large range and looks symmetrical. The answer for part b.) is: Select an answerv 5 pts 1 0 Details Question 10
Step by Step Solution
There are 3 Steps involved in it

Get step-by-step solutions from verified subject matter experts