

Question: Question 9 and 9 continued physics 20 ' searCh 9. An experiment was done to compare the volume of a liquid to its mass. Different
Question 9 and 9 continued physics 20
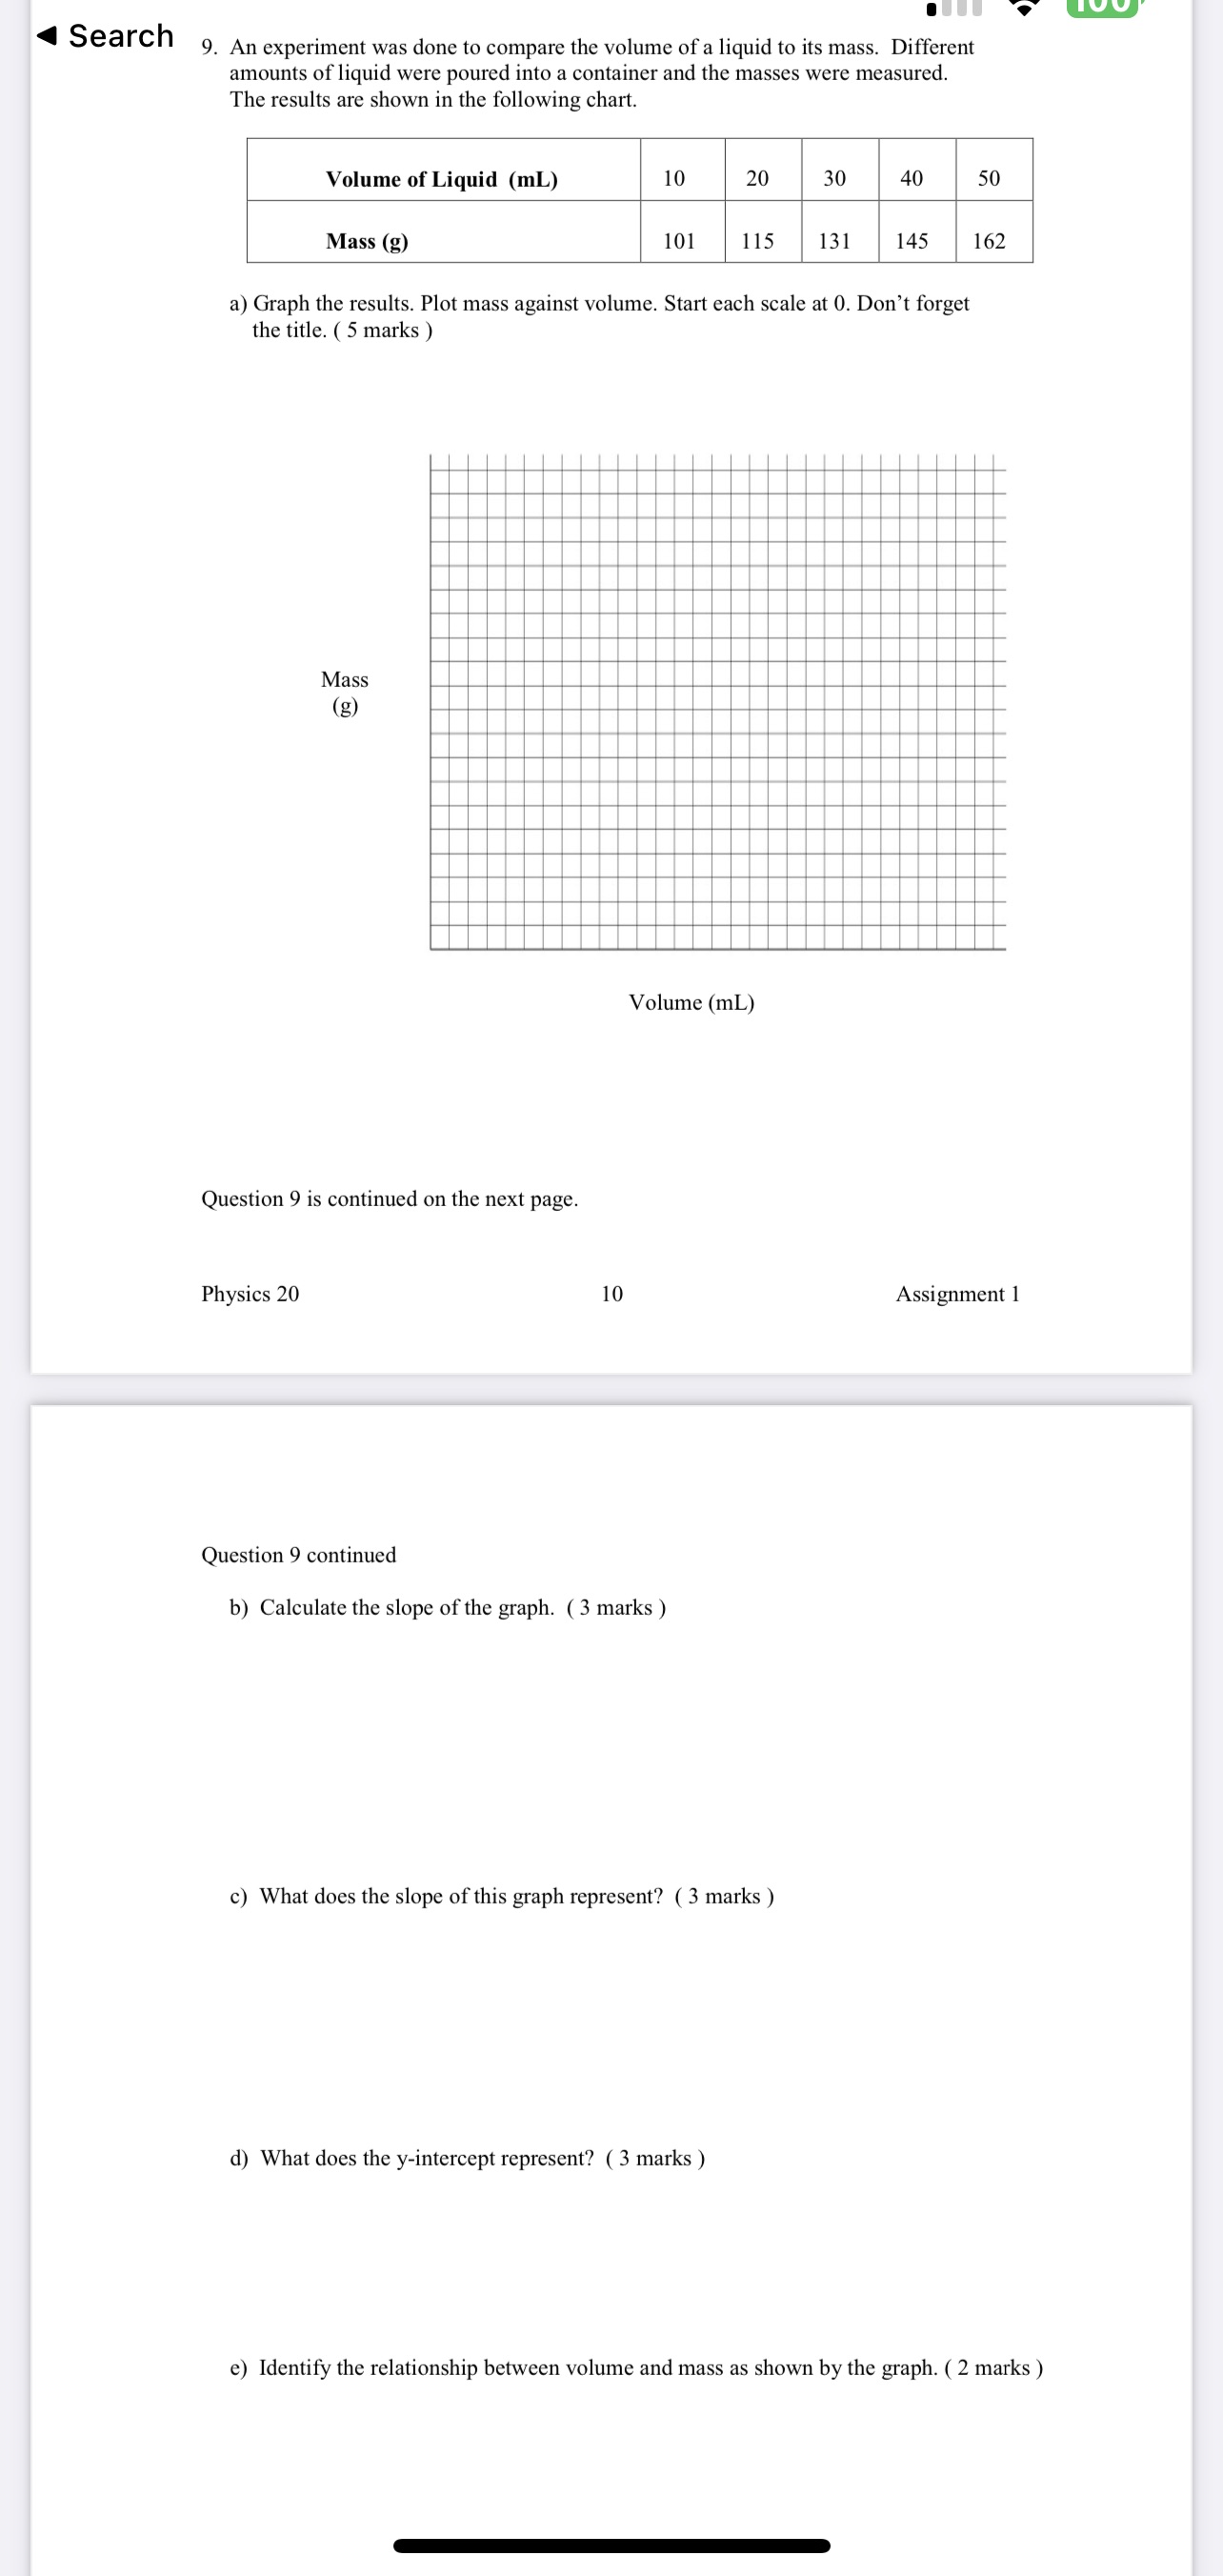
' searCh 9. An experiment was done to compare the volume of a liquid to its mass. Different amounts of liquid were poured into a container and the masses were measured. T 'ie results are shown in the following chart. Volume of Liquid (mL) 10 20 3O 40 50 Mass (g) lOl 115 l3] I45 I62 a) Graph the results. Plot mass against volume. Start each scale at 0. Don't forget the title. ( 5 marks ) Mass (g) Volume (mL) Question 9 is continued on the next page. Physics 20 10 Question 9 continued in) Calculate the slope ofthe graph. ( 3 marks ) c) What does the slope of this graph represent? ( 3 marks ) d) What does the y-intercept represent? ( 3 marks ) Assignment 1 e) Identify the relationship between volume and mass as shown by the graph. ( 2 marks )
Step by Step Solution
There are 3 Steps involved in it

Get step-by-step solutions from verified subject matter experts