

Question: Question 9 Below is a chart which shows the number of units sold by a medium sized business over the last 5 years. In 2016,
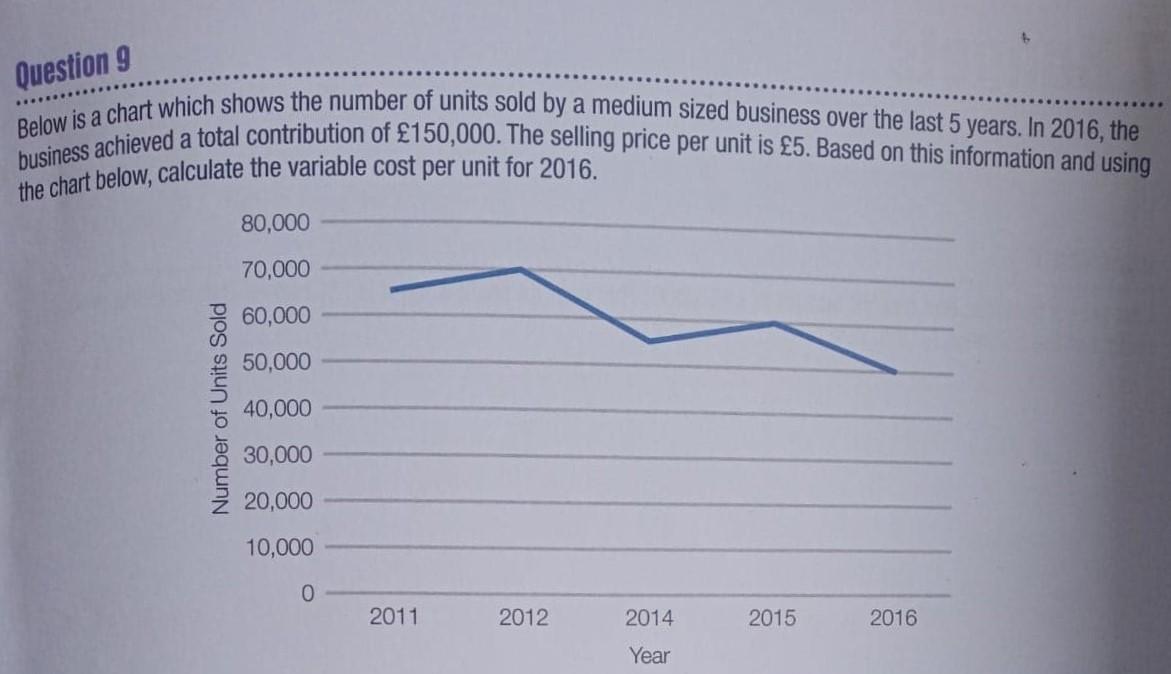
Question 9 Below is a chart which shows the number of units sold by a medium sized business over the last 5 years. In 2016, the business achieved a total contribution of 150,000. The selling price per unit is 5. Based on this information and using the chart below, calculate the variable cost per unit for 2016. 80,000 70,000 60,000 50,000 Number of Units Sold 40,000 30,000 20,000 10,000 0 2011 2012 2014 2015 2016 Year
Step by Step Solution
There are 3 Steps involved in it
1 Expert Approved Answer
Step: 1 Unlock

Question Has Been Solved by an Expert!
Get step-by-step solutions from verified subject matter experts
Step: 2 Unlock
Step: 3 Unlock