

Question: QUESTION 9 Consider a firm with the following cost structure: Quantity of Output ??FC?? VC?? TC?? 0 100 1 50 2 100 3 250 Which
QUESTION 9
Consider a firm with the following cost structure:
| Quantity of Output | ??FC?? | VC?? | TC?? |
| 0 | 100 | ||
| 1 | 50 | ||
| 2 | 100 | ||
| 3 | 250 |
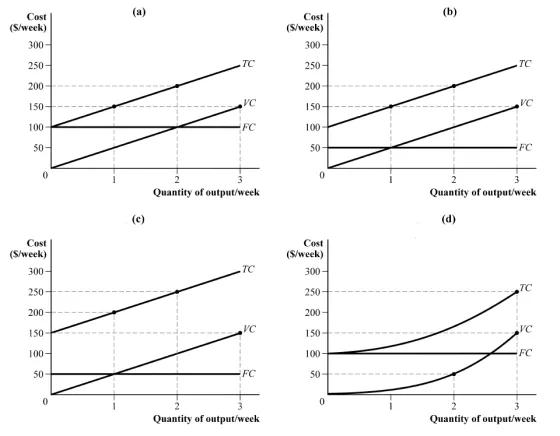
Which panel below represents the cost curves of the firm? Panela) Panel b) Panel c) Panel d)
Cost (S/week) 300- 250- 200- 150- 100 50- 0 Cost (S/week) 300- 250- 200 150 100- 50- 0 (c) TC VC FC Quantity of output/week TC VC FC Quantity of output/week Cost (S/week) 300- 250- 200 150- 100 50 0 Cost (S/week) 300- 250- 200- 150- 100- 50- 0 TC VC FC 2 3 Quantity of output/week (d) TC VC FC Quantity of output/week
Step by Step Solution
There are 3 Steps involved in it
Based on the given cost structure Panel c represents the cost curves of the firm In Panel ... View full answer

Get step-by-step solutions from verified subject matter experts