

Question: QUESTION 9 Consider the graph of a function g(t) given below. Determine which interval given below, represents an interval where g(t) has a strictly POSITIVE
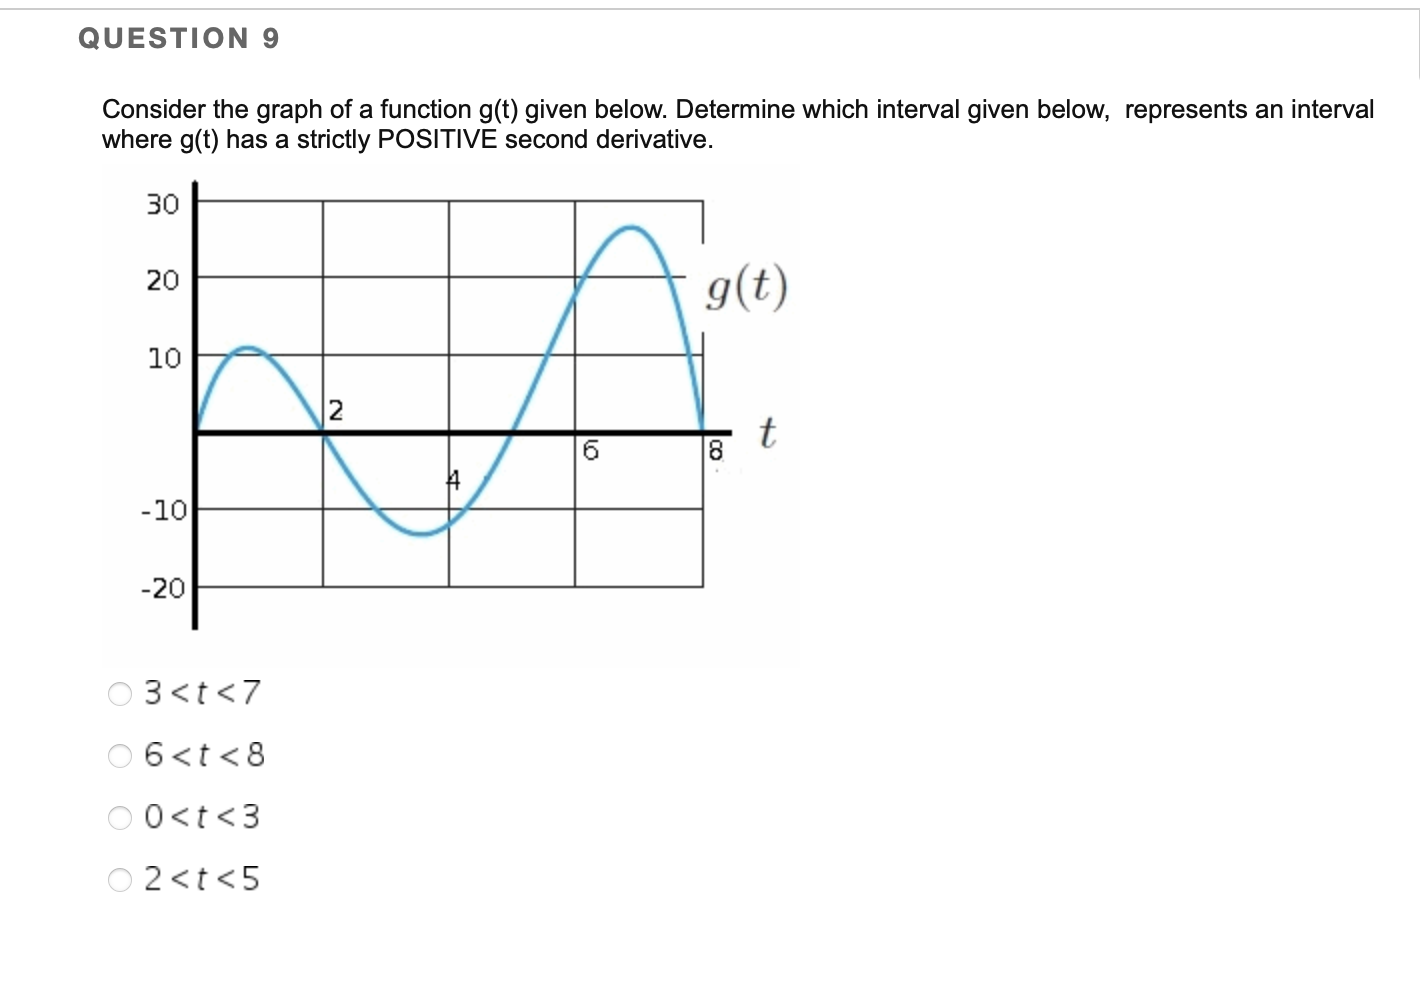

QUESTION 9 Consider the graph of a function g(t) given below. Determine which interval given below, represents an interval where g(t) has a strictly POSITIVE second derivative. 30 20 g (t ) 10 2 6 8 -10 -20 03
Step by Step Solution
There are 3 Steps involved in it
1 Expert Approved Answer
Step: 1 Unlock

Question Has Been Solved by an Expert!
Get step-by-step solutions from verified subject matter experts
Step: 2 Unlock
Step: 3 Unlock