

Question: Question 9 The statistics and chart below are the result of a textile manufacturer testing the quality of woollen yarn from two different suppliers, A
Question 9
The statistics and chart below are the result of a textile manufacturer testing the quality of woollen yarn from two different suppliers, A and B. The purpose of the testing was to determine how often the wool breaks when being woven into cloth. Each type of wool was tested 27 times. Each of the 27 tests involved weaving a full spool of yarn into clothes of different threadcount (threads per (identified in the graph below as the Denier of the cloth). The statistics and numbers plotted in the chart are the number of times the woollen yarn from a spool broke in each test. For example, the best performance of Wool Type A in a test produced 10 breaks while weaving a spool of yarn.
| Wool A: | Wool B: |
| Minimum: 10 | Minimum: 13 |
| Maximum: 70 | Maximum: 44 |
| IQR: 16.5 | IQR: 10 |

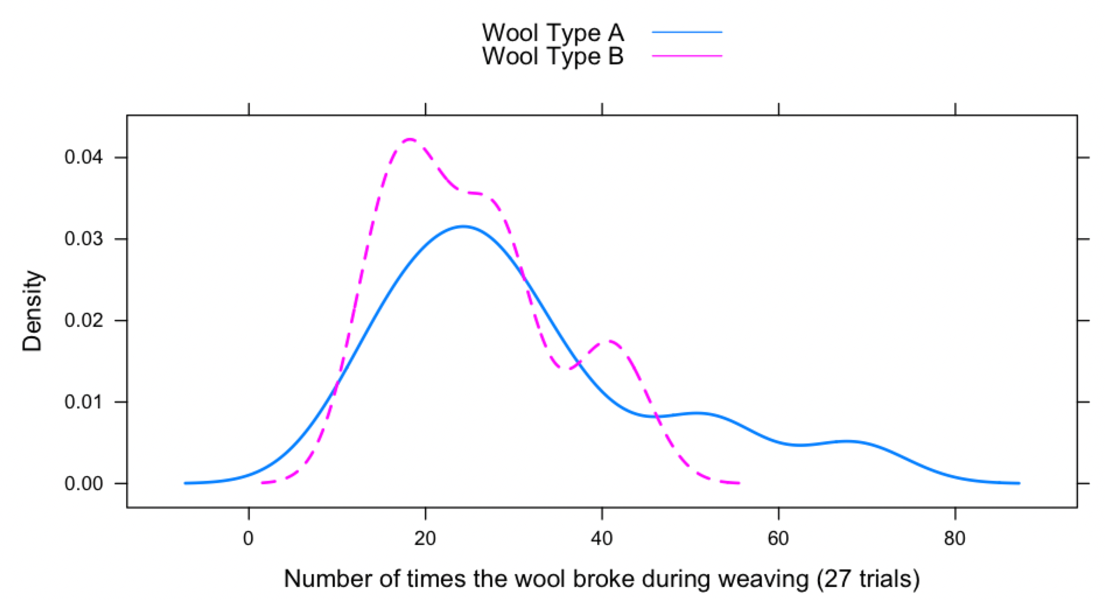
D enterWool Type A Wool Type B 0.04 0.03 - ---- Density 0.02 0.01 7 - 0.00 O 20 40 60 80 Number of times the wool broke during weaving (27 trials)
Step by Step Solution
There are 3 Steps involved in it

Get step-by-step solutions from verified subject matter experts