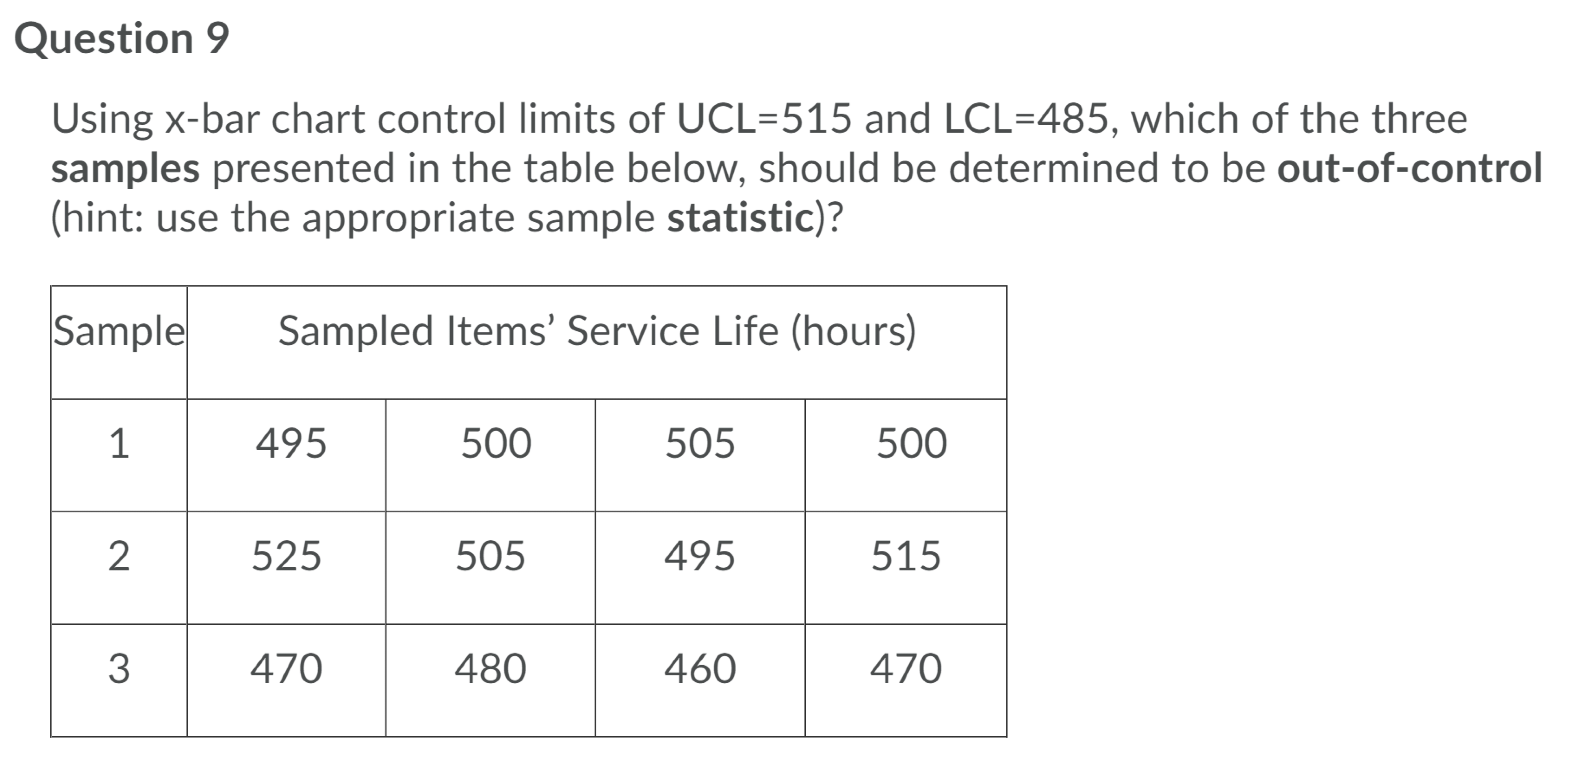
Question: Question 9 Using x-bar chart control limits of UCL=515 and LCL=485, which of the three samples presented in the table below, should be determined to

Question 9 Using x-bar chart control limits ofQuestion 9 Using x-bar chart control limits of

Question 9 Using x-bar chart control limits of UCL=515 and LCL=485, which of the three samples presented in the table below, should be determined to be out-of-control (hint: use the appropriate sample statistic)?| Sample Sampled Items' Service Life (hours) 1 495 500 505 500 2 525 505 495 515 3 470 480 460 470 Sample 1 Samples 2 & 3 & 3 Sample 2 Sample 3

Step by Step Solution

There are 3 Steps involved in it

1 Expert Approved Answer
Step: 1 Unlock blur-text-image
Question Has Been Solved by an Expert!

Get step-by-step solutions from verified subject matter experts

Step: 2 Unlock
Step: 3 Unlock

Students Have Also Explored These Related General Management Questions!