Question: Question 9 While Simon is happy with the pie prices, volumes of pies sold and contributions of the individual four pie types, he notices that
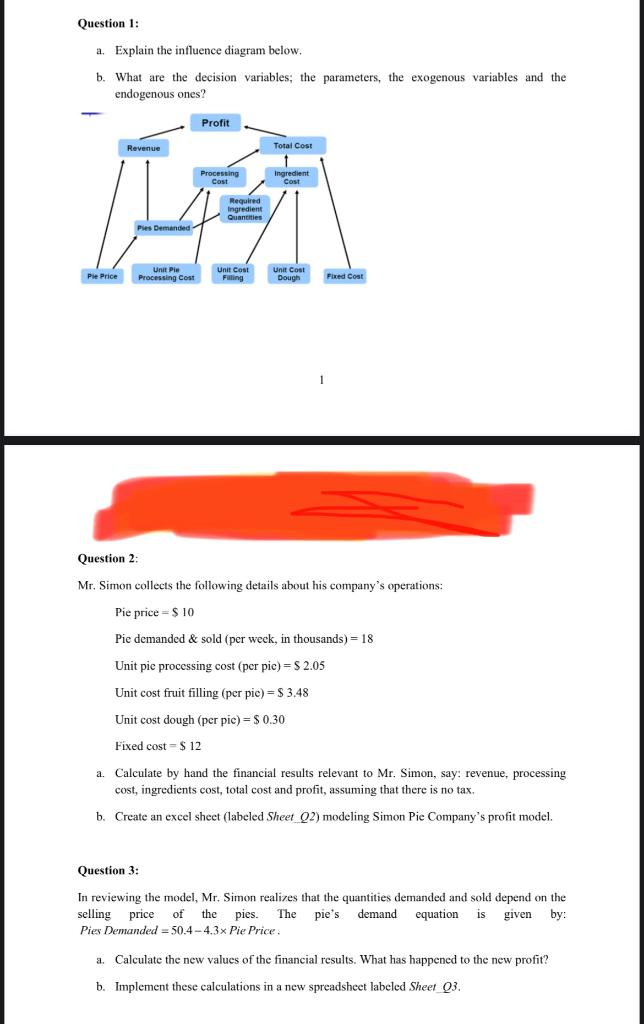
Question 9 While Simon is happy with the pie prices, volumes of pies sold and contributions of the individual four pie types, he notices that his production capacity is limited to 24,000 pies. For each additional pie to be produced he incurs a $ 0.85 cost, known as the overtime processing cost. a. By means of an appropriate IF statement implemented in an excel sheet (that you will label Sheet 09) find the new total cost processing. The usual processing cost will be renamed as "normal processing cost" opposed to the overtime processing cost which occurs when the capacity limit of 24,000 pies is exceeded. b. Find the new ingredient costs, total cost, contributions and the profit. Question 10 Run two sensitivity analyses of questions 9 by means of the Data Table tool available in Excel. a. In the first analysis one varies the normal processing capacity (from 24,000 to 34,000 pies) and the apple pie price from 80% to 120% of the base apple price $9.12) and then assesses the impact on the profit. 5 () Represent the profit for different capacity limits and different apple pie prices. The apple pie price should be on the x-axis. Interpret the results. Are the processing capacity and the apple pie price independent? b. The second sensitivity analysis evaluates the impact of the apple pie price (from 70% to 120% of the base apple price $9.12) on the different financial outcomes. Use the Data Table tool with just one input variable. Draw the related graph. Interpret the findings. Note: Create Sheet Q10a and Sheet Q10b containing all calculations and related graphs. Question 11 (Bonus) Redo the sensitivity analysis of questions 4 and 5 by means of the Data Table tools. Note: Create Sheet 011 containing all calculations. Question 7: Mr. Simon has a particular interest in his monthly profit. Here are some parameters related to four subscquent weeks: Pie price Unit cost fruit filling ($ per pic) Unit cost, dough S S 9.00 $ 3,48 S 0,30 $ 9,40 S 3,43 S 0,28 S 9.10 S 3,52 S 0.31 S 9.20 3,47 0.30 a. Compute the financial results of each week. b. Deduce the monthly values of the financial variables. In particular, what's the monthly profit? Note: Create Sheet 97 containing all calculations. Question 8 Mr. Simon is considering the expansion of his business. He wants to produce additional fruit-base pies: lemon, strawberry and cherry. The selling prices of these pies are set in terms of the apple pie price. The cherry pie is known to have the same price as an apple pie; the lemon pie is cheaper than the apple one by $ 1.00; and the strawberry pic costs $ 0.25 more than an apple pic. This expansion however raises the overhead cost to $ 33,000. As expected, Mr. Simon finds that the demand and processing cost equations as well as the unit ingredient costs are slightly different from one fruit to another (see the table below). The demand equations are respectively: Apple Pies Demanded = 52.4 -4.2x Apple Pie Price. Lemon Pies Demanded = 55.6-4.6x Lemon Pie Price Strawberry Pies Demanded = 55-4.5x Strawberry Pie Price Cherry Pies Demanded = 56.6-4.7x Cherry Pie Price The apple pic is $9.12. The processing costs are respectively: Apple: see Questions Lemon: Processing Cost =-12.5+4.5x Production 4 Strawberry: Processing Cost = -12.4+3.6x Production Cherry: Processing Cost-12.6+3.26x Production In addition, the ingredients costs are provided in the table below. Apple Unit cost fruit filling (S per pie) Unit cost, dough Fixed cost (000's) 3,48 0,3 Lemon 2,2 0.28 Strawberry Cherry Total 3,9 0.35 0.33 33 a. Compute the usual financial outcomes. In particular show the contributions of each pie type and deduce the profit. b. Draw a stacked column plot of the revenue, the contribution, the ingredient cost and the processing cost with the fruits on the horizontal axis, Note: Create Sheet 98 containing all calculations as well as the stacked column plot. Question 4: Mr. Simon wants to evaluate the impact on the profit of the pie price. In order to efficiently run such a sensitivity analysis, he considers the percentage changes in the pie prices relatively to a fixed value: S 9. The different percentages are in the interval (70% to 130%) with an increment of 5% between two subsequent values. What are the different prices used in this sensitivity analysis? a 2 b. Compute the financial results for each pie price. Use an Excel sheet (Sheet 04) for the required calculations. What is the maximizing profit price? Which price should Mr. Simon set if he wants to sell the maximum number of pies? Draw a graph representing the revenue, the total cost and the profit for different pie prices. Interpret it. Question 5: It appears that the actual weekly pie profits of Simon Pie Company are less than projected. Mr. Simon suspects the processing cost formula to be misleading. In order to validate this part of the profit model, he collects data from his company on the different processing costs for various levels of pie production. See the table below. & 10 12 14 16 18 20 Number of Pies 6 (000's) 22 10.2 13.5 23.6 31.4 40,1 44.3 54.1 58.9 Processing cost 9.1 (Actual) a. Draw a graph representing the actual processing cost and the projected one with respect to the number of pies demanded and sold. b. Add a linear trend as a fit for the actual processing cost. The new graph obtained should display the processing cost equation. c. With the equation of processing cost generated, compute the new values of the financial results. Note: Create Sheet_05 containing all calculations and graphs. Question 6: a. Do a sensitivity analysis of question 5 for pie prices between $ 8.5 and $ 10. b. Represent the financial results derived, with the pie prices on the horizontal axis. All calculations and graphs should appear on Sheet 26. 3 Question 1: a. Explain the influence diagram below. b. What are the decision variables; the parameters, the exogenous variables and the endogenous ones? Profit Revenue Total Cost Processing Cost Ingredient Cost Required Ingredient Quantities Pies Demanded 1 Pie Price Unit Pie Processing Cost Unit Cost Filling Unit Cost Dough Fixed Cost Question 2: Mr. Simon collects the following details about his company's operations: Pie price = $ 10 Pie demanded & sold (per week, in thousands) = 18 Unit pic processing cost (per pic) = S 2.05 Unit cost fruit filling (per pic) = $ 3.48 Unit cost dough (per pic) = $ 0.30 Fixed cost = $ 12 a. Calculate by hand the financial results relevant to Mr. Simon, say: revenue, processing cost, ingredients cost, total cost and profit, assuming that there is no tax, b. Create an excel sheet (labeled Sheet 02) modeling Simon Pie Company's profit model. Question 3: In reviewing the model, Mr. Simon realizes that the quantities demanded and sold depend on the selling price of the pies. The pies demand equation is given by: Pies Demanded = 50.4 -4.3x Pie Price a. Calculate the new values of the financial results. What has happened to the new profit? b. Implement these calculations in a new spreadsheet labeled Sheet 03


