

Question: Question 9/10 Question 9 (1 point) Students in a statistics class took their first test. The following table lists the scores they earned. 671 67
Question 9/10
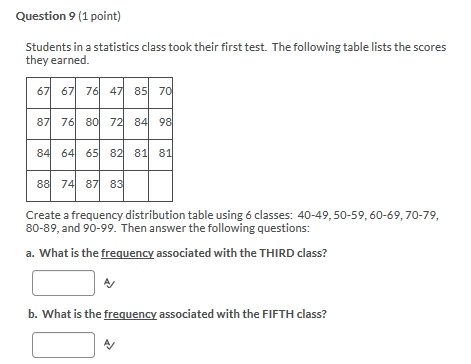
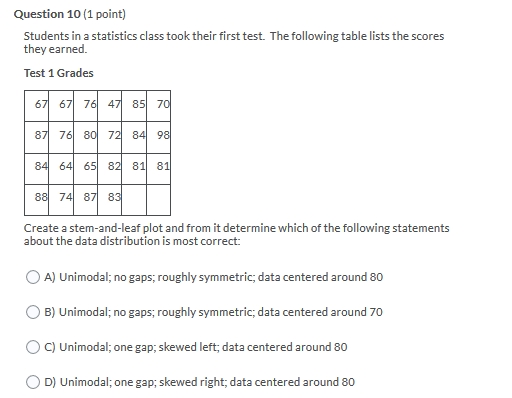
Question 9 (1 point) Students in a statistics class took their first test. The following table lists the scores they earned. 671 67 76 47 85 70 87 76 80 72 84 98 84 64 65 82 81 81 88 74 87 83 Create a frequency distribution table using 6 classes: 40-49, 50-59, 60-69,70-79, 80-89, and 90-99. Then answer the following questions: a. What is the frequency associated with the THIRD class? b. What is the frequency associated with the FIFTH class?Question 10 (1 point) Students in a statistics class took their first test. The following table lists the scores they earned. Test 1 Grades 67 67 76 47 85 70 87 76 80 72 84 98 84 64 65 82 81 81 88 74 87 83 Create a stem-and-leaf plot and from it determine which of the following statements about the data distribution is most correct: (O A) Unimodal; no gaps; roughly symmetric; data centered around 80 () B) Unimodal; no gaps; roughly symmetric; data centered around 70 O C) Unimodal; one gap; skewed left; data centered around 80 O D) Unimodal; one gap; skewed right; data centered around 80
Step by Step Solution
There are 3 Steps involved in it

Get step-by-step solutions from verified subject matter experts