

Question: Question: A B C D E F H K M Historical Results Forecast Period 9 Coporate Finance Instute. All rights reser... (3 bookmarks) B D
Question: A B C D E F H K M Historical Results Forecast Period 9 Coporate Finance Instute. All rights reser...
(3 bookmarks)
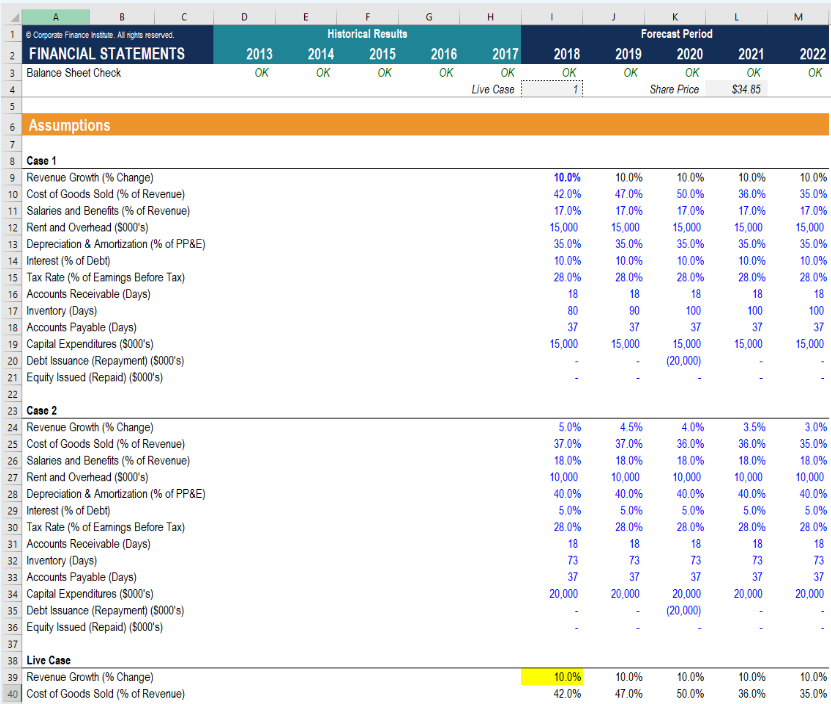
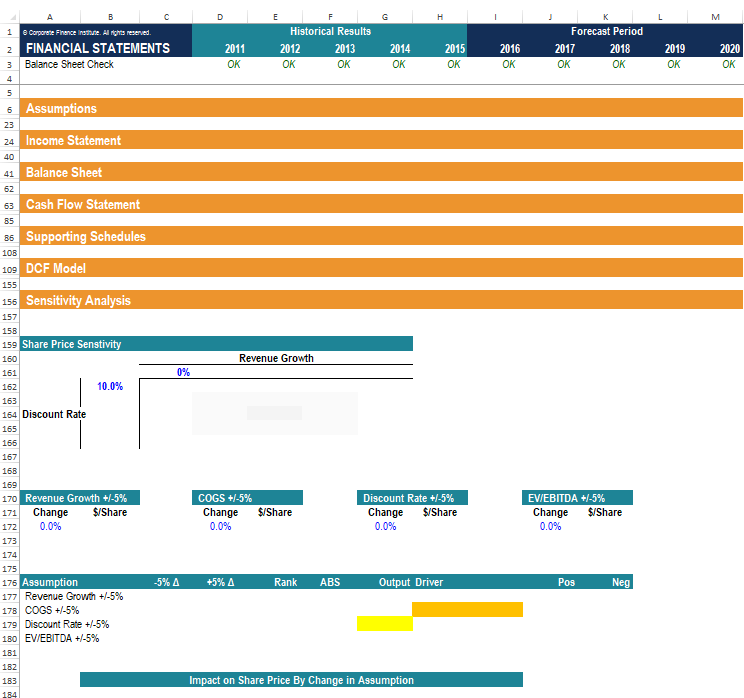
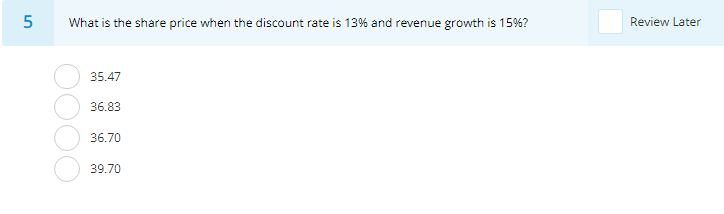
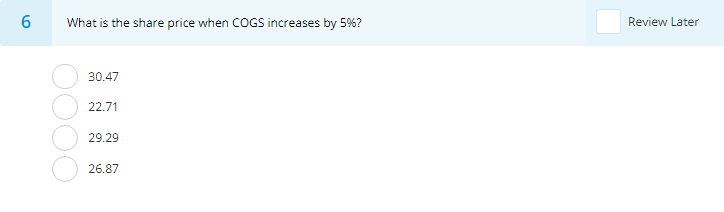
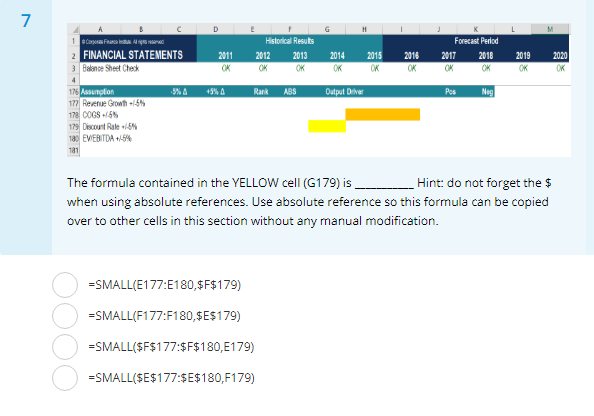
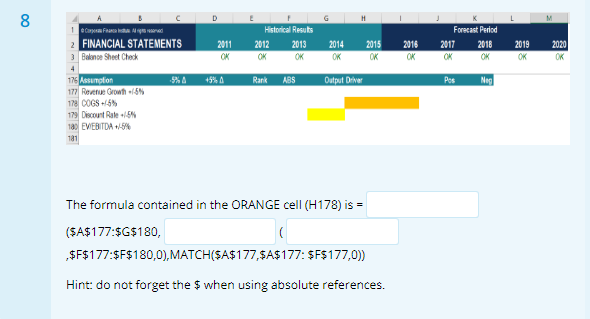
B D F M E Historical Results 2014 2015 OK 2013 OK 2016 OK 2017 OK Live Case K Forecast Period 2019 2020 OK OK Share Price 2018 OK 11 OK 2021 OK $34.85 2022 OK 10.0% 42.0% 17.0% 15,000 35.0% 10.0% 28.0% 18 80 37 15,000 10.0% 47.0% 17.0% 15,000 35.0% 10.0% 28.0% 18 90 37 15,000 10.0% 50.0% 17.0% 15,000 35.0% 10.0% 28.0% 18 100 37 15,000 (20,000) 10.0% 36.0% 17.0% 15,000 35.0% 10.0% 28.0% 18 100 37 15,000 1 Corporate Finance Institute. All rights reserved. 2 FINANCIAL STATEMENTS 3 Balance Sheet Check 4 5 6 Assumptions 7 8 Case 1 9 Revenue Growth (% Change) 10 Cost of Goods Sold (% of Revenue) 11 Salaries and Benefits (% of Revenue) 12 Rent and Overhead (S000's) 13 Depreciation & Amortization (% of PP&E) 14 Interest (% of Debt) 15 Tax Rate(% of Eamings Before Tax) 16 Accounts Receivable (Days) 17 Inventory (Days) 18 Accounts Payable (Days) 19 Capital Expenditures (S000's) 20 Debt Issuance (Repayment) (S000's) 21 Equity Issued (Repaid) (9000's) 22 23 Case 2 24 Revenue Growth (% Change) 25 Cost of Goods Sold (% of Revenue) 26 Salaries and Benefits (% of Revenue) 27 Rent and Overhead (S000's) 28 Depreciation & Amortization (% of PP&E) 29 Interest (% of Debt) 30 Tax Rate (% of Earnings Before Tax) 31 Accounts Receivable (Days) 32 Inventory (Days) 33 Accounts Payable (Days) 34 Capital Expenditures (5000's) 35 Debt Issuance (Repayment) (S000's) 36 Equity Issued (Repaid) ($000's) 37 38 Live Case 39 Revenue Growth % Change) 40 Cost of Goods Sold (% of Revenue) 10.0% 35.0% 17.0% 15,000 35.0% 10.0% 28.0% 18 100 37 15,000 5.0% 37.0% 18.0% 10,000 40.0% 5.0% 28.0% 18 73 37 20,000 4.5% 37.0% 18.0% 10,000 40.0% 5.0% 28.0% 18 73 37 20,000 4.0% 36.0% 18.0% 10,000 40.0% 5.0% 28.0% 18 73 37 20.000 (20,000) 3.5% 36.0% 18.0% 10,000 40.0% 5.0% 28.0% 18 73 37 20.000 3.0% 35.0% 18.0% 10,000 40.0% 5.0% 28.0% 18 73 37 20,000 10.0% 42.0% 10.0% 47.0% 10.0% 50.0% 10.0% 36.0% 10.0% 35.0% B M 1 E Historical Results 2012 2013 OK 8 Corporate Finance inste. Al rights reserved FINANCIAL STATEMENTS Balance Sheet Check 2 2011 OK 2014 OK 2015 OK 2016 OK Forecast Period 2017 2018 OK OK 2019 OK 2020 OK 3 OK 4 Revenue Growth 0% 5 6 Assumptions 23 24 Income Statement 40 41 Balance Sheet 62 63 Cash Flow Statement 85 85 Supporting Schedules 10B 109 DCF Model 155 156 Sensitivity Analysis 157 158 159 Share Price Senstivity 160 161 162 10.0% 163 164 Discount Rate 165 165 167 16B 169 170 Revenue Growth +/-5% 171 Change $/Share 172 0.0% 173 174 175 176 Assumption 177 Revenue Growth +/-5% 178 COGS +/-5% 179 Discount Rate +/-5% 160 EV/EBITDA +/-5% 181 182 183 184 COGS +/-5% Change 0.0% $/Share Discount Rate +/-5% Change $/Share 0.0% EV/EBITDA +/-5% Change $/Share 0.0% -5% A +5% A Rank ABS Output Driver Pos Neg Impact on Share Price By Change in Assumption 5 What is the share price when the discount rate is 13% and revenue growth is 1596? Review Later 35.47 36.83 36.70 39.70 6 What is the share price when COGS increases by 5%? Review Later 30.47 22.71 29.29 26.87 7 H Historical Results 2012 2013 OK OK 2014 OK 2015 OK 2016 OK Forecast Period 2017 2018 OK 2019 OK 2020 OK C D 1 Cara 2 FINANCIAL STATEMENTS 2011 3. Balance Sheet Check OK 4 176 Assunoon 177 Revenue Grow-45% 178 COGS 65 179 Discount Rale 5% 180 EV EBITDA +15% 781 Rank ABS Output Deliver Pos Nog The formula contained in the YELLOW cell (G179) is Hint: do not forget the $ when using absolute references. Use absolute reference so this formula can be copied over to other cells in this section without any manual modification. =SMALL(E177:E180,$F$179) =SMALL(F177:F180,$E$179) =SMALL($F$177:$F$180,E179) =SMALL($E$177:$E$180,F179) 00 D M Cura Fred FINANCIAL STATEMENTS 3 Balance Sheet Check E Historical Results 2012 2013 OK 2011 OK 2014 OK 2011 2015 OK 2016 OK Forecast Period 2018 OK OK 2019 OK 2020 OK +5% Rank ABS Output Driver Pos Nag 176 Assumption 177 Revenue Grow 5% 178 DOGS 55 179 Discount Rate 54 100 EVEBITDA +-5% 181 The formula contained in the ORANGE cell (H178) is = ($A$177:$G$180, $F$177:$F$180,0), MATCH($A$177,$A$177: $F$177,0)) Hint: do not forget the $ when using absolute references. 9 What type of chart did we use to build a tornado chart? Tornado chart Column chart Clustered bar chart Stacked bar chart B D F M E Historical Results 2014 2015 OK 2013 OK 2016 OK 2017 OK Live Case K Forecast Period 2019 2020 OK OK Share Price 2018 OK 11 OK 2021 OK $34.85 2022 OK 10.0% 42.0% 17.0% 15,000 35.0% 10.0% 28.0% 18 80 37 15,000 10.0% 47.0% 17.0% 15,000 35.0% 10.0% 28.0% 18 90 37 15,000 10.0% 50.0% 17.0% 15,000 35.0% 10.0% 28.0% 18 100 37 15,000 (20,000) 10.0% 36.0% 17.0% 15,000 35.0% 10.0% 28.0% 18 100 37 15,000 1 Corporate Finance Institute. All rights reserved. 2 FINANCIAL STATEMENTS 3 Balance Sheet Check 4 5 6 Assumptions 7 8 Case 1 9 Revenue Growth (% Change) 10 Cost of Goods Sold (% of Revenue) 11 Salaries and Benefits (% of Revenue) 12 Rent and Overhead (S000's) 13 Depreciation & Amortization (% of PP&E) 14 Interest (% of Debt) 15 Tax Rate(% of Eamings Before Tax) 16 Accounts Receivable (Days) 17 Inventory (Days) 18 Accounts Payable (Days) 19 Capital Expenditures (S000's) 20 Debt Issuance (Repayment) (S000's) 21 Equity Issued (Repaid) (9000's) 22 23 Case 2 24 Revenue Growth (% Change) 25 Cost of Goods Sold (% of Revenue) 26 Salaries and Benefits (% of Revenue) 27 Rent and Overhead (S000's) 28 Depreciation & Amortization (% of PP&E) 29 Interest (% of Debt) 30 Tax Rate (% of Earnings Before Tax) 31 Accounts Receivable (Days) 32 Inventory (Days) 33 Accounts Payable (Days) 34 Capital Expenditures (5000's) 35 Debt Issuance (Repayment) (S000's) 36 Equity Issued (Repaid) ($000's) 37 38 Live Case 39 Revenue Growth % Change) 40 Cost of Goods Sold (% of Revenue) 10.0% 35.0% 17.0% 15,000 35.0% 10.0% 28.0% 18 100 37 15,000 5.0% 37.0% 18.0% 10,000 40.0% 5.0% 28.0% 18 73 37 20,000 4.5% 37.0% 18.0% 10,000 40.0% 5.0% 28.0% 18 73 37 20,000 4.0% 36.0% 18.0% 10,000 40.0% 5.0% 28.0% 18 73 37 20.000 (20,000) 3.5% 36.0% 18.0% 10,000 40.0% 5.0% 28.0% 18 73 37 20.000 3.0% 35.0% 18.0% 10,000 40.0% 5.0% 28.0% 18 73 37 20,000 10.0% 42.0% 10.0% 47.0% 10.0% 50.0% 10.0% 36.0% 10.0% 35.0% B M 1 E Historical Results 2012 2013 OK 8 Corporate Finance inste. Al rights reserved FINANCIAL STATEMENTS Balance Sheet Check 2 2011 OK 2014 OK 2015 OK 2016 OK Forecast Period 2017 2018 OK OK 2019 OK 2020 OK 3 OK 4 Revenue Growth 0% 5 6 Assumptions 23 24 Income Statement 40 41 Balance Sheet 62 63 Cash Flow Statement 85 85 Supporting Schedules 10B 109 DCF Model 155 156 Sensitivity Analysis 157 158 159 Share Price Senstivity 160 161 162 10.0% 163 164 Discount Rate 165 165 167 16B 169 170 Revenue Growth +/-5% 171 Change $/Share 172 0.0% 173 174 175 176 Assumption 177 Revenue Growth +/-5% 178 COGS +/-5% 179 Discount Rate +/-5% 160 EV/EBITDA +/-5% 181 182 183 184 COGS +/-5% Change 0.0% $/Share Discount Rate +/-5% Change $/Share 0.0% EV/EBITDA +/-5% Change $/Share 0.0% -5% A +5% A Rank ABS Output Driver Pos Neg Impact on Share Price By Change in Assumption 5 What is the share price when the discount rate is 13% and revenue growth is 1596? Review Later 35.47 36.83 36.70 39.70 6 What is the share price when COGS increases by 5%? Review Later 30.47 22.71 29.29 26.87 7 H Historical Results 2012 2013 OK OK 2014 OK 2015 OK 2016 OK Forecast Period 2017 2018 OK 2019 OK 2020 OK C D 1 Cara 2 FINANCIAL STATEMENTS 2011 3. Balance Sheet Check OK 4 176 Assunoon 177 Revenue Grow-45% 178 COGS 65 179 Discount Rale 5% 180 EV EBITDA +15% 781 Rank ABS Output Deliver Pos Nog The formula contained in the YELLOW cell (G179) is Hint: do not forget the $ when using absolute references. Use absolute reference so this formula can be copied over to other cells in this section without any manual modification. =SMALL(E177:E180,$F$179) =SMALL(F177:F180,$E$179) =SMALL($F$177:$F$180,E179) =SMALL($E$177:$E$180,F179) 00 D M Cura Fred FINANCIAL STATEMENTS 3 Balance Sheet Check E Historical Results 2012 2013 OK 2011 OK 2014 OK 2011 2015 OK 2016 OK Forecast Period 2018 OK OK 2019 OK 2020 OK +5% Rank ABS Output Driver Pos Nag 176 Assumption 177 Revenue Grow 5% 178 DOGS 55 179 Discount Rate 54 100 EVEBITDA +-5% 181 The formula contained in the ORANGE cell (H178) is = ($A$177:$G$180, $F$177:$F$180,0), MATCH($A$177,$A$177: $F$177,0)) Hint: do not forget the $ when using absolute references. 9 What type of chart did we use to build a tornado chart? Tornado chart Column chart Clustered bar chart Stacked bar chart
Step by Step Solution
There are 3 Steps involved in it

Get step-by-step solutions from verified subject matter experts