

Question: Question ! A large County school system tracks annual state-level evaluations of it's elementary schools. Below are evaluations for the last school year. Evaluation Number
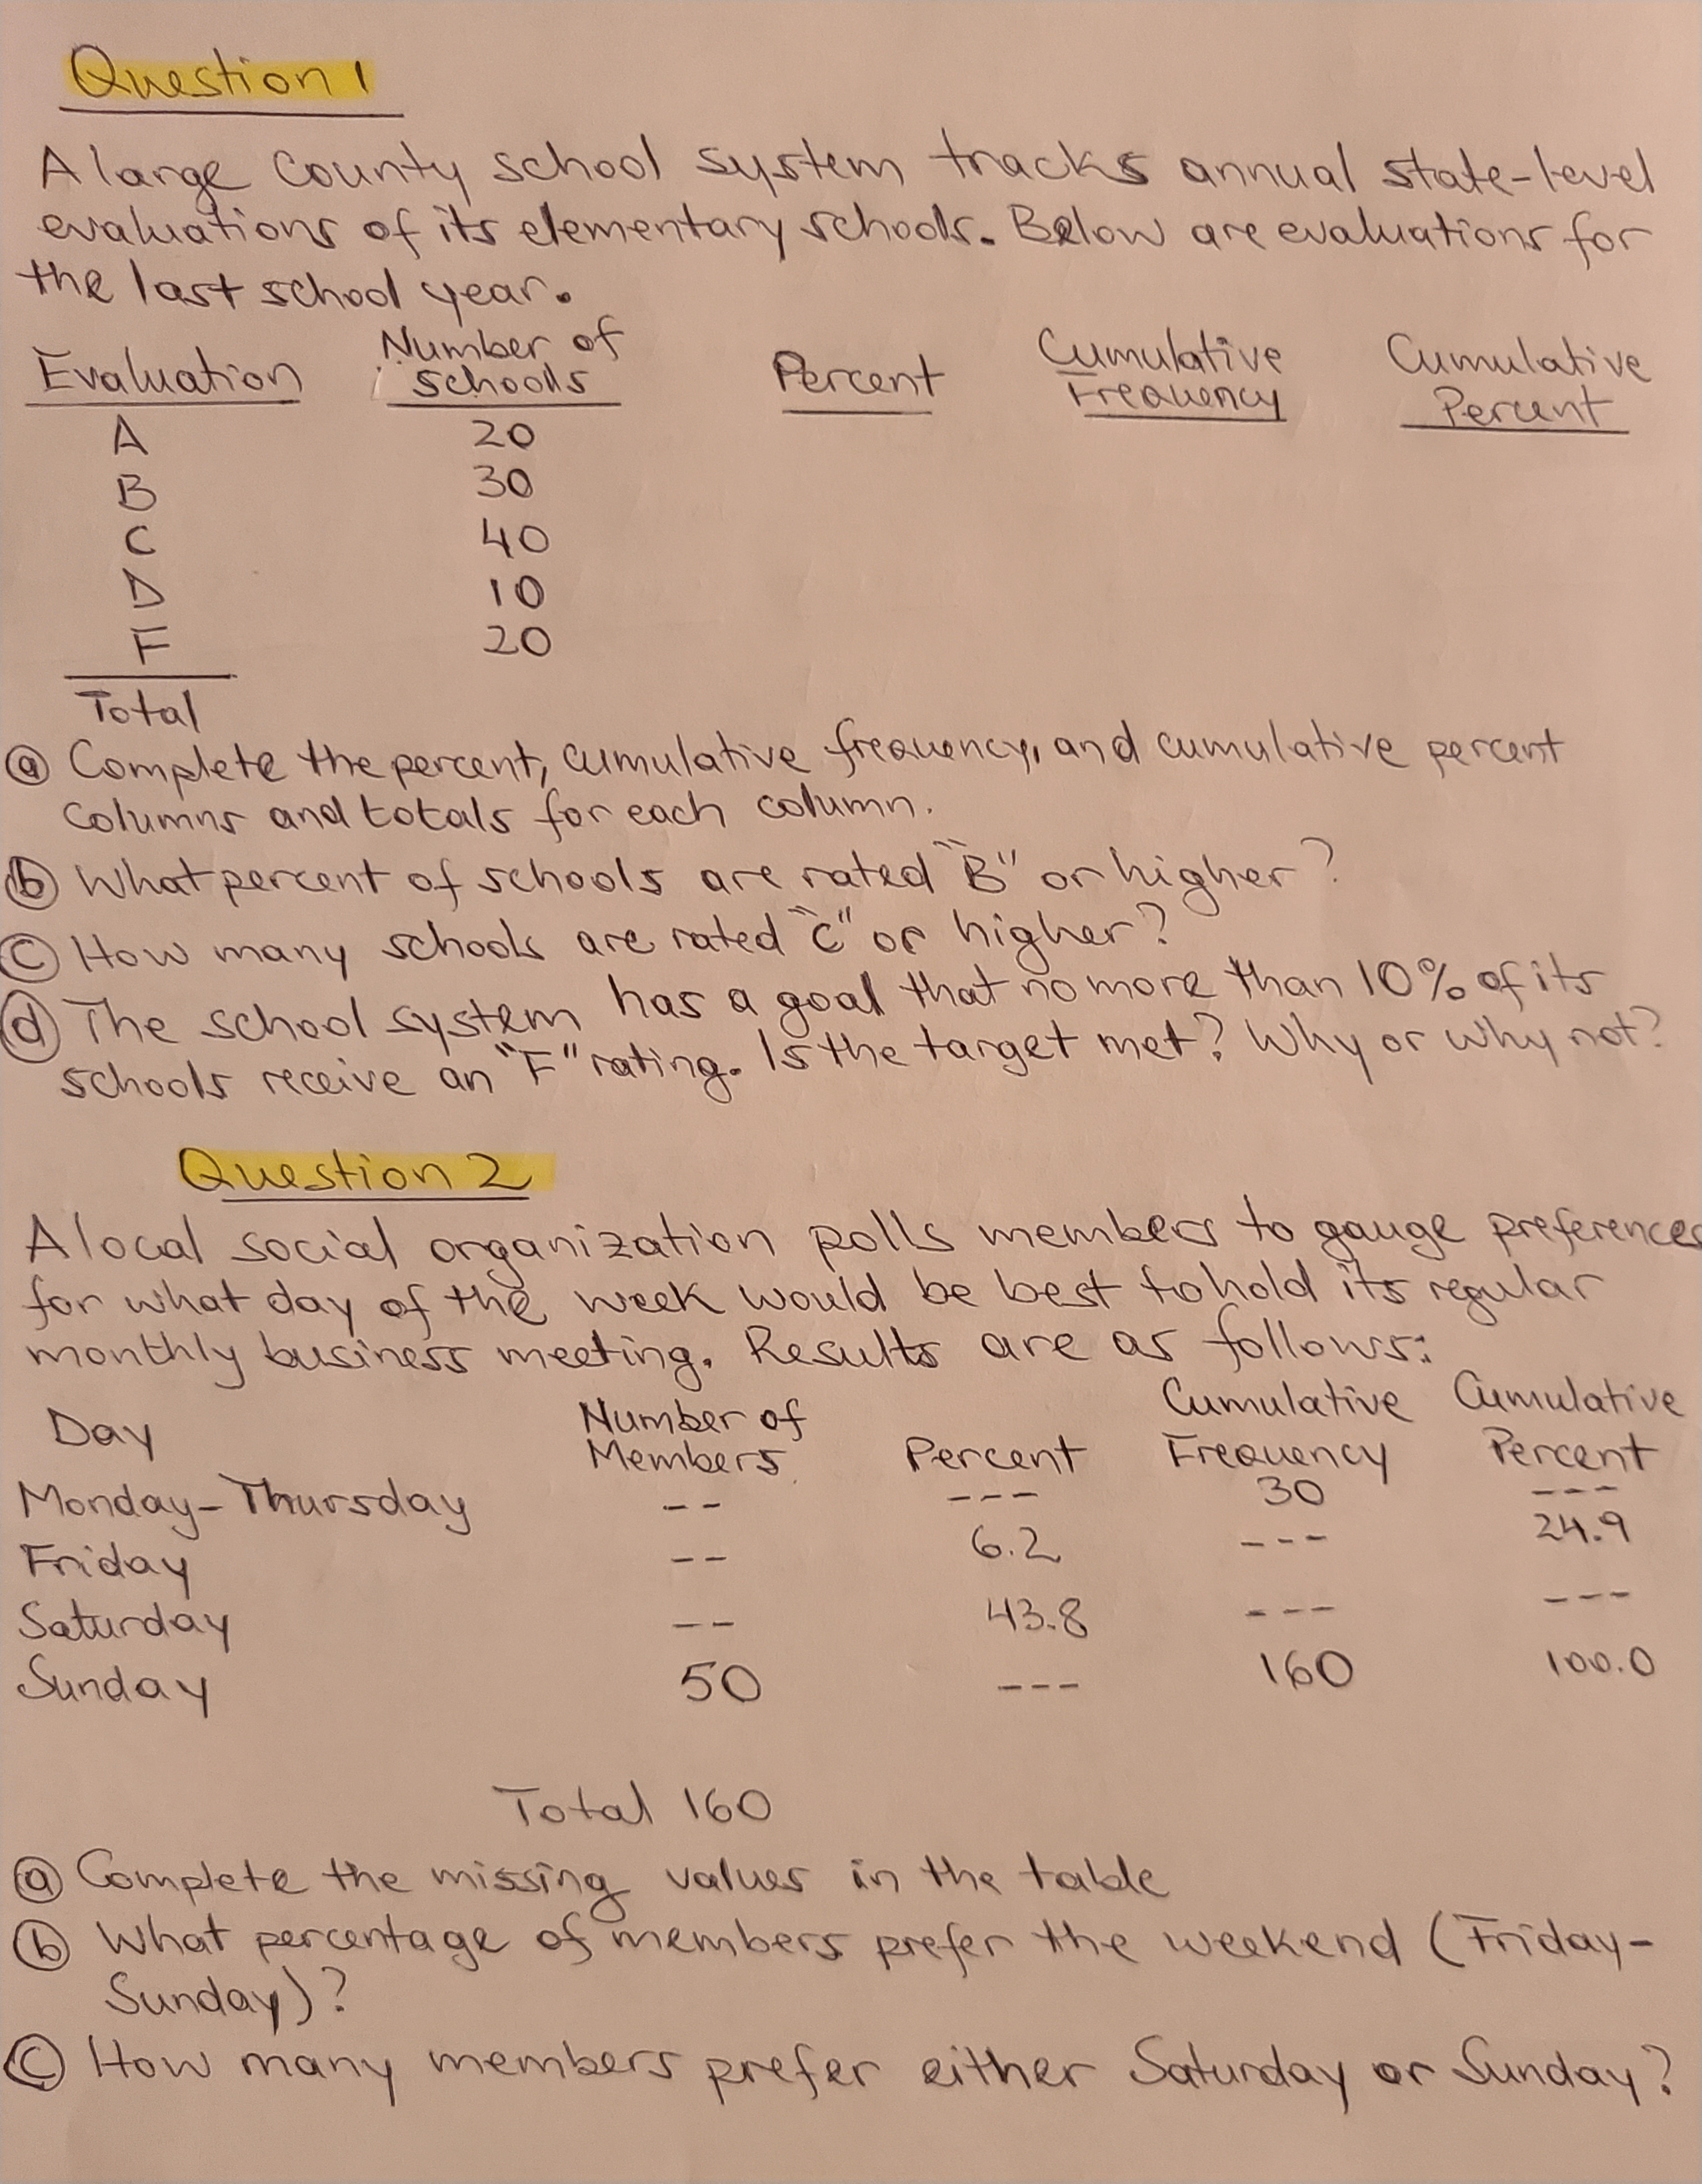
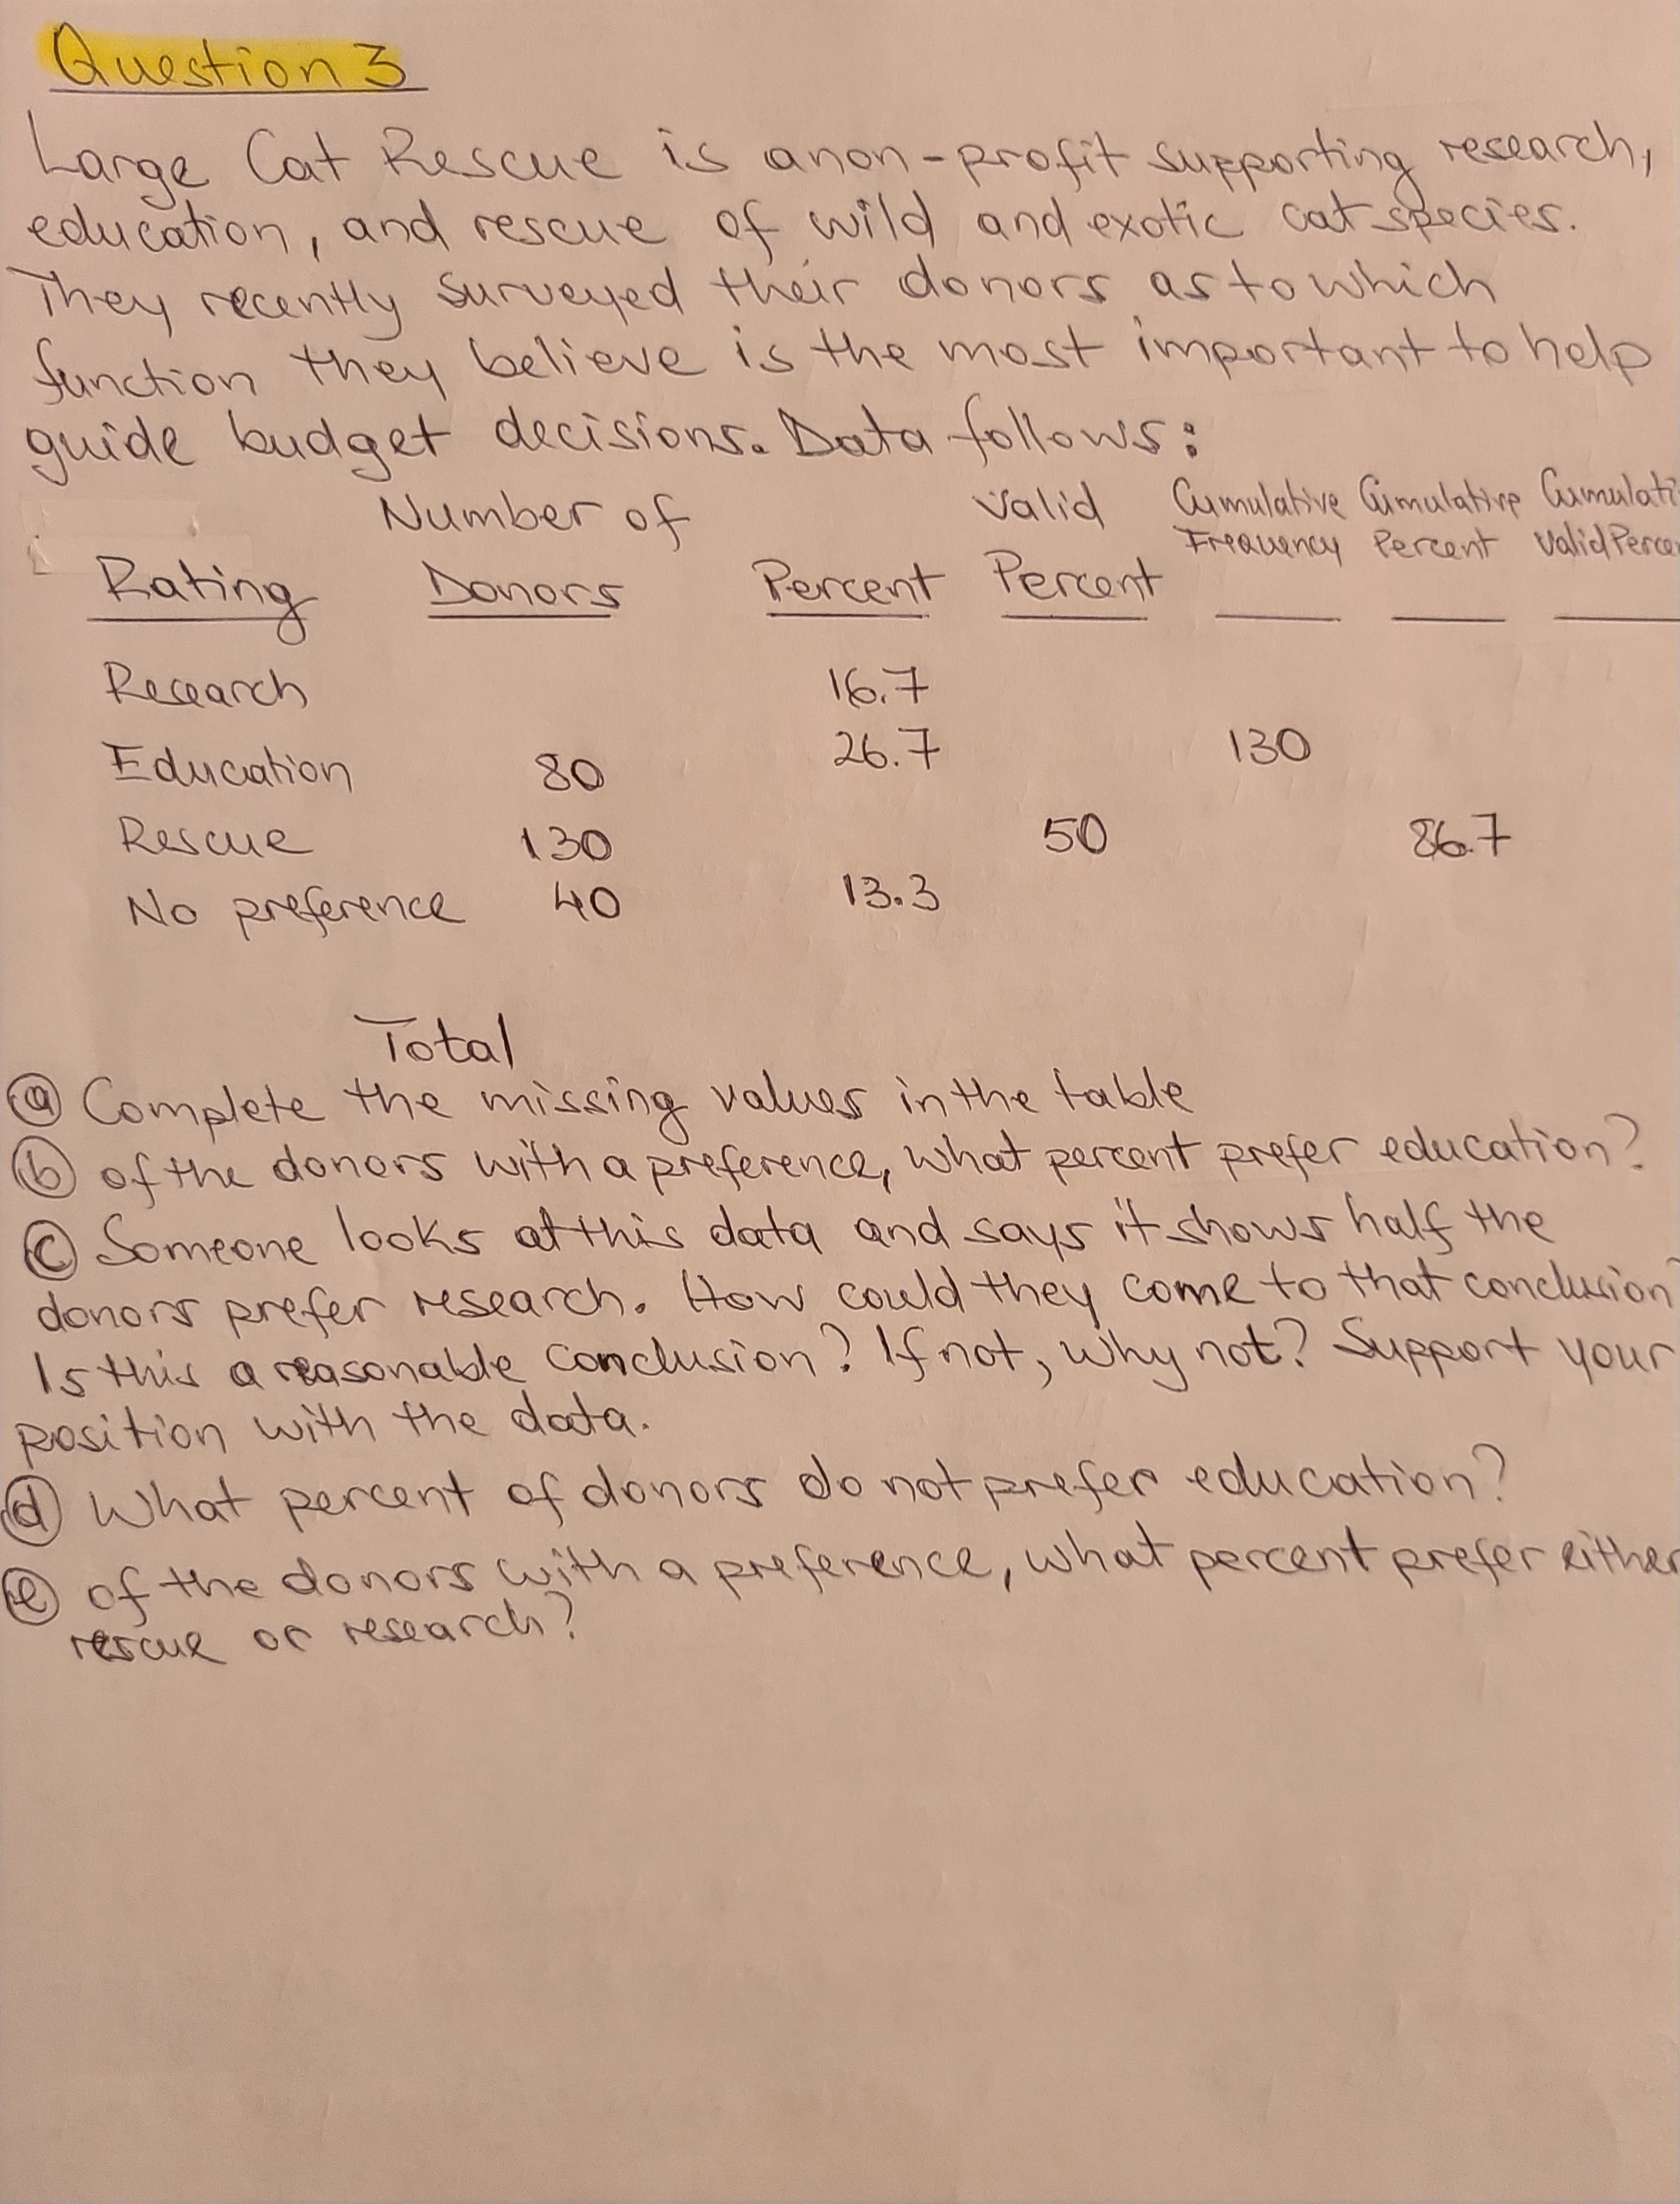
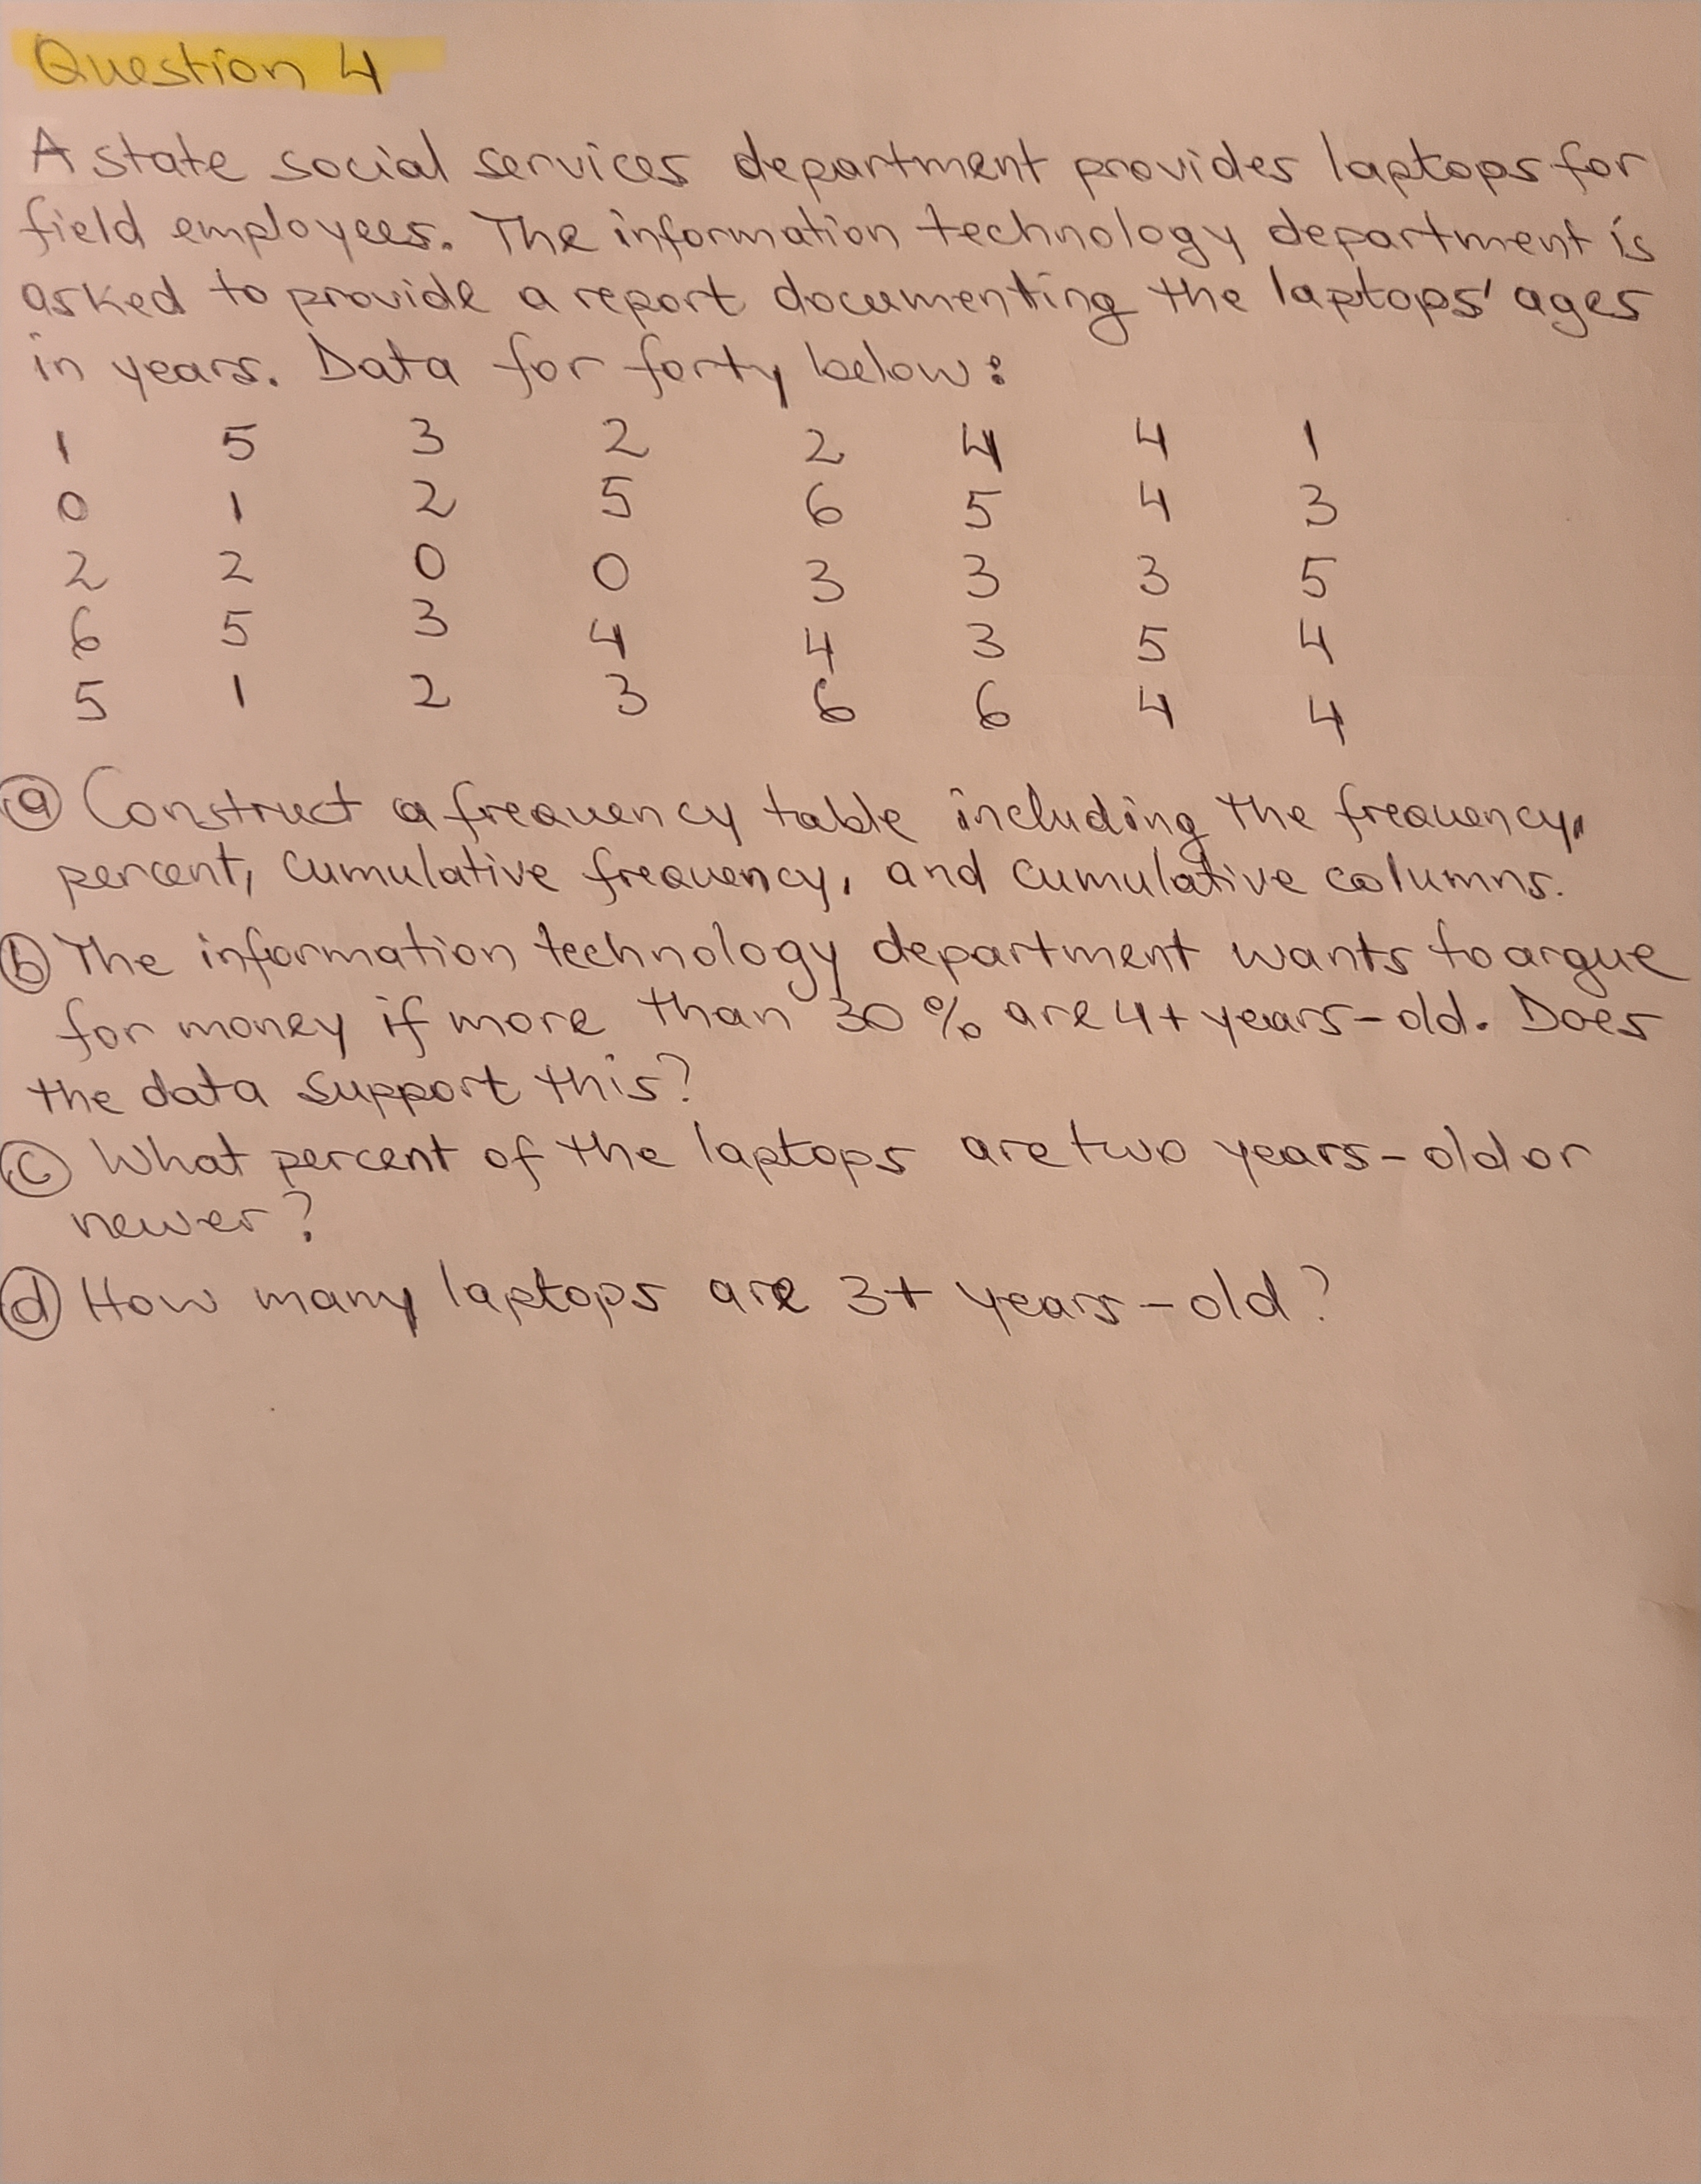
Question ! A large County school system tracks annual state-level evaluations of it's elementary schools. Below are evaluations for the last school year. Evaluation Number of schools Percent Cumulative Cumulative Frequency 20 Percent 30 40 10 20 Total Complete the percent, cumulative frequency, and cumulative percent Columns and totals for each column. b what percent of schools are rated B" on higher? How many schools are rated "(" of higher? d) The school system has a goal that no more than 10% of its Schools receive an "F" rating. Is the target met ? Why or why not? Question 2 Alocal social organization polls members to gauge preference for what day of the week would be best to hold its regular monthly business meeting, Results are as follows: Day Number of Cumulative Cumulative Members Percent Frequency Percent Monday- Thursday 30 6.2 24.9 Friday Saturday 43.8 Sunday 50 160 100.0 - - - Total 160 Complete the missing values in the table b What percentage of members prefer the weekend ( Friday- Sunday) ? How many members prefer either Saturday or Sunday?Question 3 Large Cat Rescue is anon-profit supporting research, education , and rescue of wild and exotic cat species . They recently surveyed their donors as to which function they believe is the most important to help guide budget decisions. Data follows: Number of valid Cumulative Gimulating Cumulati Rating Donors Percent Percent Frequency Percent Valid Perce Recearch 16.7 Education 80 26.7 130 Rescue 130 50 86.7 No preference 40 13.3 Total Complete the missing values in the table of the donors with a preference, what percent prefer education? @ Someone looks at this data and says it shows half the donors prefer research. How could they come to that conclusion Is this a reasonable conclusion ? If not, why not? Support your position with the data. d What percent of donors do not prefer education? of the donors with a preference, what percent prefer either rescue of research ?Question 4 A state social services department provides laptops for field employees. The information technology department is asked to provide a report documenting the laptops' ages In years. Data for forty below : ON U WONW - UI N - JI 3 9 Construct a frequency table including the frequency. percent , cumulative frequency , and cumulative columns . The information technology department wants to argue for money if more than 30 %% are 4+ years-old. Does the data support this? . What percent of the laptops are two years- old or newer? d How many laptops are 3+ years- old
Step by Step Solution
There are 3 Steps involved in it

Get step-by-step solutions from verified subject matter experts