

Question: QUESTION A. Note: output and cost data are expressed in thousands of dollars and each item sold for $5.00 (1) Complete the table. (2) Use
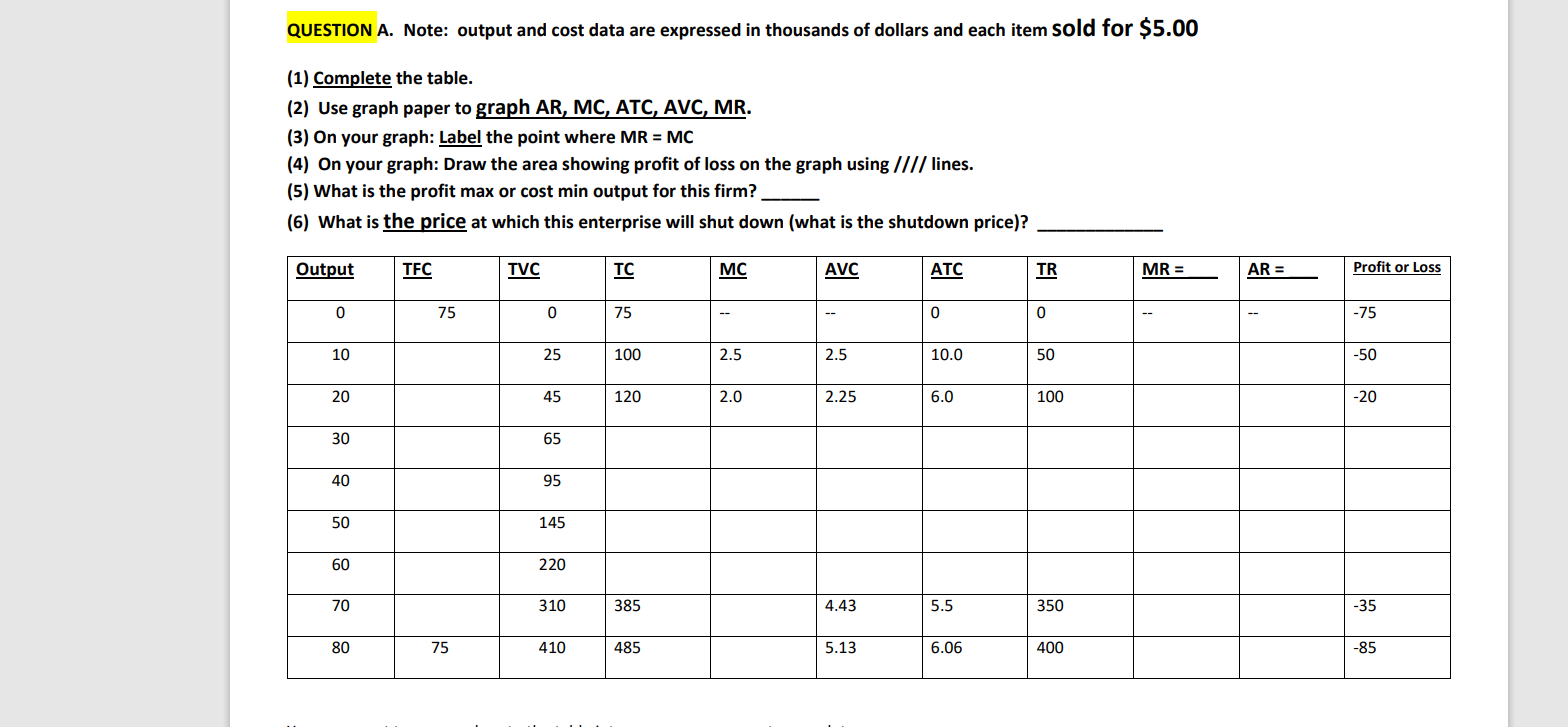
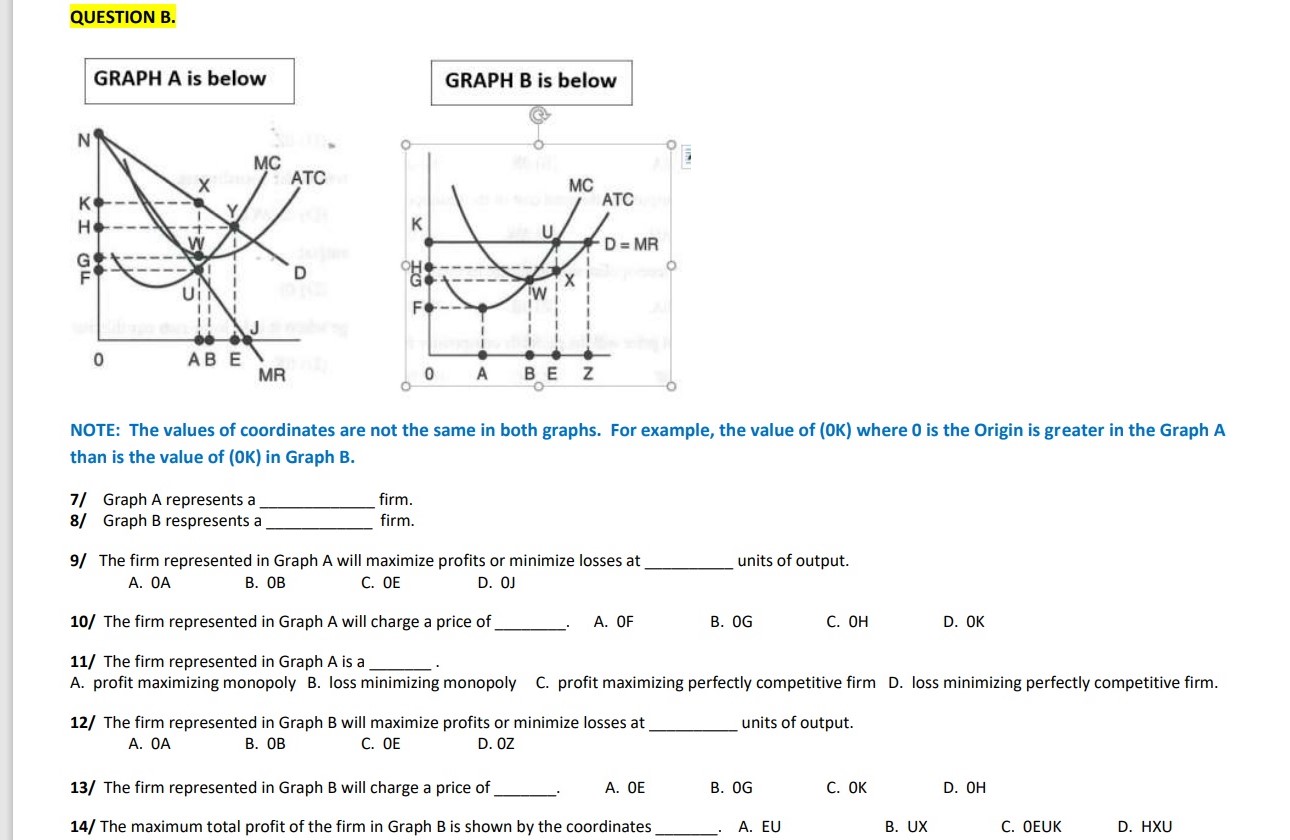
QUESTION A. Note: output and cost data are expressed in thousands of dollars and each item sold for $5.00 (1) Complete the table. (2) Use graph paper to graph AR, MC, ATC, AVC, MR. (3) On your graph: Label the point where MR = MC (4) On your graph: Draw the area showing profit of loss on the graph using //// lines. (5) What is the profit max or cost min output for this firm?_ (6) What is the price at which this enterprise will shut down (what is the shutdown price)? Output TFC TVC TC MC AVC ATC TR MR = AR = Profit or Loss 0 75 0 75 0 0 -75 10 25 100 2.5 2.5 10.0 50 -50 20 45 120 2.0 2.25 6.0 100 -20 30 65 40 95 50 145 60 220 70 310 385 4.43 5.5 350 -35 80 75 410 485 5.13 6.06 400 -85QUESTION B. GRAPH A is below GRAPH B is below N o--_ 2 K H g o 0 NOTE: The values of coordinates are not the same in both graphs. For example, the value of (OK) where O is the Origin is greater in the Graph A than is the value of (ax) in Graph B. '1] Glaph A represents a firm. 8/ Graph 3 respresents a firm. 9/ The firm represented in Graph A will maximize profits or minimize losses at units of output. A. 0A B. OB C. DE D. DJ 10/ The firm represented in GraphAwill charge a price of . A. OF E. [JG C. DH D. 0K 11] The firm represented in Graph A Is a . A. profit maximizing monopoly B. loss minimizing monopoly C. prot maximizing perfectly competitive firm D. loss minimizing perfectly competitive firm. 12] The firm represented in Graph 3 will maximize profits or minimize losses at units of output. A. 0A B. OB C. 0E D. 02 13/ The firm represented in Graph Bwill charge a price of . A. 0E E. (JG C. 0K D. 0H 14/ The maximum total prot of the firm in Graph B is shown by the coordinates . A. EU B. U)! C. OEUK D. HXU
Step by Step Solution
There are 3 Steps involved in it

Get step-by-step solutions from verified subject matter experts